ARCHIVES (2015)
Do roku 2016 raport oznaczony numerem 1 był tworzony za okres od 1 kwietnia do 31 maja. Od roku 2017 analizy są wykonywane o dekadę wcześniej czyli 1 raport oznacza okres od 21 marca do 20 maja
Communication report regarding the incidences of drought conditions in Poland
Year: 2015; period: 09 (21.VI - 20.VIII)
The Institute of Soil Science and Plant Cultivation - State Research Institute in accordance with an Act from the Minister of Agriculture and Rural Development has developed the climatic water balance for all Polish municipalities (3,064 municipalities), and based on the soils categories have identified in those municipalities the current agricultural drought risk for the following crops: winter and spring cereals, corn for grain and silage, oilseed rape and turnip rape, sugar beet, potatoes, hops, tobacco, field vegetables, shrubs and fruit trees and strawberries and legumes.
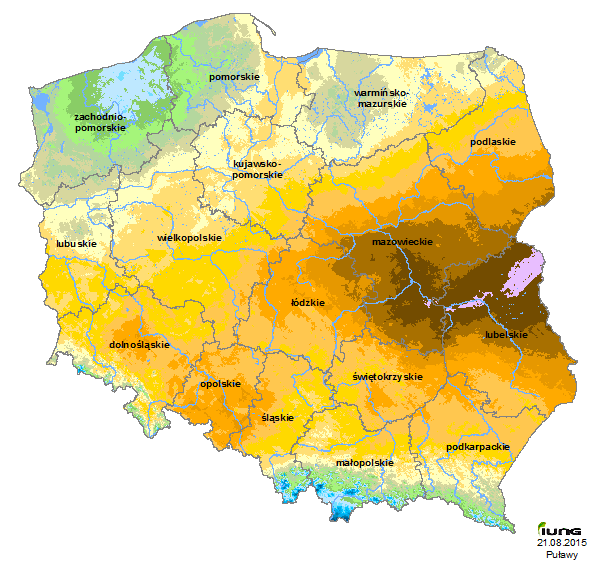
In the ninth reporting period, i.e. from June 21 to August 20, 2015, does state a risk of agricultural drought in Poland. The values of climatic water balance (CWB), which are the basis to assess the risk of drought, are negative.
In the current sixty days period threat to agricultural drought occurs among crops:
- Legumes
- Potato
- Shrubs
- Hops
- Tobacco
- Ground vegetables
- Maize for silage
- Maize for grain
- Sugarbeet
- Fruit trees
The biggest threat of drought in Poland occurs for Legumes crops. Drought for the crop occurs in soils:
- I category (very light soil, granulometric group: sand
- II category (light soil, granulometric group: loamy sand)
- III - medium-heavy soil, (granulometric group: sandy loam, silt)
- IV - heavy soil, (granulometric group: sandy clay loam, loam, clay loam, silt loam, clay)
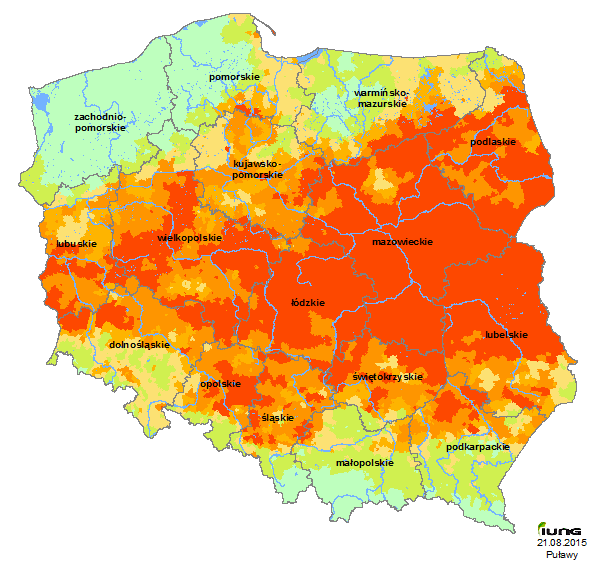
Drought for these crops occurs in all voivodeships of the country, in 2952 local districts (96.3% of local districts) on 52.4% of arable land. In six voivodeships (Lubuskie, Lodzkie, Mazowieckie, Opolskie, Podlaskie and Wielkopolskie) drought was observed in 100% of local districts. A little lower risk of drought occurred in Lubelskie and Dolnośląskie voivodeships (respectively 99.6 and 99.1%). In five voivodeships have been reported drought in over 90% of local districts. Detailed data on drought risk for that crop group are presented in Table 1.
Table 1. Risk of agricultural drought for leguminous crops
| No. | Voivodeship | Number of local districts | Number of local districts at risk | The share of local districts under risk [%] | The share of arable land under risk[%] |
|---|---|---|---|---|---|
| 1 | lubuskie | 116 | 116 | 100.0 | 59.9 |
| 2 | łódzkie | 202 | 202 | 100.0 | 79.1 |
| 3 | mazowieckie | 364 | 364 | 100.0 | 89.2 |
| 4 | opolskie | 103 | 103 | 100.0 | 35.2 |
| 5 | podlaskie | 141 | 141 | 100.0 | 65.7 |
| 6 | wielkopolskie | 316 | 316 | 100.0 | 72.3 |
| 7 | lubelskie | 234 | 233 | 99.6 | 71.8 |
| 8 | dolnośląskie | 224 | 222 | 99.1 | 33.0 |
| 9 | kujawsko-pomorskie | 179 | 177 | 98.9 | 46.0 |
| 10 | warmińsko-mazurskie | 149 | 146 | 98.0 | 25.9 |
| 11 | świętokrzyskie | 128 | 125 | 97.7 | 47.0 |
| 12 | śląskie | 189 | 184 | 97.4 | 48.5 |
| 13 | pomorskie | 140 | 136 | 97.1 | 28.7 |
| 14 | podkarpackie | 189 | 176 | 93.1 | 25.7 |
| 15 | małopolskie | 225 | 199 | 88.4 | 11.7 |
| 16 | zachodniopomorskie | 165 | 112 | 67.9 | 12.0 |
| Polska | 3064 | 2952 | 96.3 | 52.4 |
Drought risk for potato occurs on soils category I, II, III and IV. It is present in 16 voivodeships 2697 local districts (88% of local districts in the country) on 53,3 % of the arable land. The greatest risk occurs in voivodeships : lubelskim, łódzkim, mazowieckim, opolskim, podlaskim where 100% of local districts with this crop was under threat of drought. Detailed data on this crop are presented in Table 2.
Table 2. The threat of agricultural drought for potato cultivation.
| No. | Voivodeship | Number of local districts | Number of local districts at risk | The share of local districts under risk [%] | The share of arable land under risk [%] |
|---|---|---|---|---|---|
| 1 | lubelskie | 234 | 234 | 100.0 | 79.1 |
| 2 | łódzkie | 202 | 202 | 100.0 | 89.6 |
| 3 | mazowieckie | 364 | 364 | 100.0 | 92.8 |
| 4 | opolskie | 103 | 103 | 100.0 | 46.1 |
| 5 | podlaskie | 141 | 141 | 100.0 | 72.1 |
| 6 | świętokrzyskie | 128 | 126 | 98.4 | 63.1 |
| 7 | kujawsko-pomorskie | 179 | 176 | 98.3 | 45.8 |
| 8 | wielkopolskie | 316 | 310 | 98.1 | 70.9 |
| 9 | dolnośląskie | 224 | 219 | 97.8 | 36.3 |
| 10 | lubuskie | 116 | 111 | 95.7 | 51.6 |
| 11 | podkarpackie | 189 | 168 | 88.9 | 26.8 |
| 12 | śląskie | 189 | 165 | 87.3 | 50.2 |
| 13 | warmińsko-mazurskie | 149 | 120 | 80.5 | 18.2 |
| 14 | małopolskie | 225 | 168 | 74.7 | 10.9 |
| 15 | pomorskie | 140 | 77 | 55.0 | 9.6 |
| 16 | zachodniopomorskie | 165 | 13 | 7.9 | 0.3 |
| Polska | 3064 | 2697 | 88.0 | 53.3 |
Drought risk for fruit shrubs occurs on soils category I, II, III and IV. It is present in 16 voivodeships 2697 local districts (88% of local districts in the country) on 53,3 % of the arable land. The greatest risk occurs in voivodeships : lubelskim, łódzkim, mazowieckim, opolskim, podlaskim where 100% of local districts with this crop was under threat of drought. In Świętokrzyskie, Kujawsko -Pomorskie, Wielkopolskie there were more than 98% of local districts threatened by agricultural drought in the cultivation of fruit shrubs. Detailed data on this crop are presented in Table 3.
Table 3. The threat of agricultural drought for fruit shrubs cultivation
| No. | Voivodeship | Number of local districts | Number of local districts at risk | The share of local districts under risk [%] | The share of arable land under risk [%] |
|---|---|---|---|---|---|
| 1 | lubelskie | 234 | 234 | 100.0 | 79.1 |
| 2 | łódzkie | 202 | 202 | 100.0 | 89.6 |
| 3 | mazowieckie | 364 | 364 | 100.0 | 92.8 |
| 4 | opolskie | 103 | 103 | 100.0 | 46.1 |
| 5 | podlaskie | 141 | 141 | 100.0 | 72.1 |
| 6 | świętokrzyskie | 128 | 126 | 98.4 | 63.1 |
| 7 | kujawsko-pomorskie | 179 | 176 | 98.3 | 45.8 |
| 8 | wielkopolskie | 316 | 310 | 98.1 | 70.9 |
| 9 | dolnośląskie | 224 | 219 | 97.8 | 36.3 |
| 10 | lubuskie | 116 | 111 | 95.7 | 51.6 |
| 11 | podkarpackie | 189 | 168 | 88.9 | 26.8 |
| 12 | śląskie | 189 | 165 | 87.3 | 50.2 |
| 13 | warmińsko-mazurskie | 149 | 120 | 80.5 | 18.2 |
| 14 | małopolskie | 225 | 168 | 74.7 | 10.9 |
| 15 | pomorskie | 140 | 77 | 55.0 | 9.6 |
| 16 | zachodniopomorskie | 165 | 13 | 7.9 | 0.3 |
| Polska | 3064 | 2697 | 88.0 | 53.3 |
Drought risk for hops occurs on soils category I and II. Drought (potential) for this cultivation occurs 13 voivodeships 1578 local districts (51,5% of local districts in the country) on 19.2 % of the arable land. The greatest risk occurs in voivodeships : łódzkim, where 100% of local districts with this crop was under threat of drought. There is a very high risk in Lubelskie ,Świętokrzyskie, Opolskie and Mazowieckie (in more than 90% of local districts). Detailed data on this crop are presented in Table 4.
Table 4. The threat of agricultural drought for hops cultivation
| No. | Voivodeship | Number of local districts | Number of local districts at risk | The share of local districts under risk [%] | The share of arable land under risk [%] |
|---|---|---|---|---|---|
| 1 | łódzkie | 202 | 202 | 100.0 | 48.0 |
| 2 | lubelskie | 234 | 229 | 97.9 | 39.6 |
| 3 | świętokrzyskie | 128 | 124 | 96.9 | 22.7 |
| 4 | opolskie | 103 | 98 | 95.1 | 13.4 |
| 5 | mazowieckie | 364 | 339 | 93.1 | 52.3 |
| 6 | podlaskie | 141 | 112 | 79.4 | 30.2 |
| 7 | dolnośląskie | 224 | 134 | 59.8 | 6.6 |
| 8 | śląskie | 189 | 104 | 55.0 | 12.7 |
| 9 | podkarpackie | 189 | 91 | 48.1 | 12.7 |
| 10 | wielkopolskie | 316 | 93 | 29.4 | 8.2 |
| 11 | małopolskie | 225 | 28 | 12.4 | 1.2 |
| 12 | kujawsko-pomorskie | 179 | 22 | 12.3 | 1.1 |
| 13 | lubuskie | 116 | 2 | 1.7 | 0.0 |
| Polska | 3064 | 1578 | 51.5 | 19.2 |
Drought risk for tobacco occurs on soils category I, II and III. Drought (potential) for this cultivation occurs 12 voivodeships 1091 local districts (35,6% of local districts in the country) on 14.3 % of the arable land. The greatest risk occurs in voivodeships : lubelskim, where 91% of local districts with this crop was under threat of drought. There is a very high risk in Opolskie, Mazowieckie and Łódzkie (in more than 80% of local districts). Detailed data on this crop are presented in Table 5.
Table 5. The threat of agricultural drought for tobacco cultivation
| No. | Voivodeship | Number of local districts | Number of local districts at risk | The share of local districts under risk [%] | The share of arable land under risk [%] |
|---|---|---|---|---|---|
| 1 | lubelskie | 234 | 213 | 91.0 | 38.8 |
| 2 | opolskie | 103 | 90 | 87.4 | 8.7 |
| 3 | mazowieckie | 364 | 311 | 85.4 | 48.2 |
| 4 | łódzkie | 202 | 163 | 80.7 | 34.6 |
| 5 | świętokrzyskie | 128 | 87 | 68.0 | 9.7 |
| 6 | podlaskie | 141 | 79 | 56.0 | 19.9 |
| 7 | dolnośląskie | 224 | 56 | 25.0 | 1.6 |
| 8 | śląskie | 189 | 37 | 19.6 | 1.8 |
| 9 | podkarpackie | 189 | 29 | 15.3 | 2.0 |
| 10 | wielkopolskie | 316 | 24 | 7.6 | 1.1 |
| 11 | kujawsko-pomorskie | 179 | 1 | 0.6 | 0.0 |
| 12 | małopolskie | 225 | 1 | 0.4 | 0.0 |
| Polska | 3064 | 1091 | 35.6 | 14.3 |
Drought risk for ground vegetables occurs on soils category I and II. Drought for this cultivation occurs 12 voivodeships 1090 local districts (35,6% of local districts in the country) on 12.6 % of the arable land. The greatest risk occurs in voivodeships : lubelskim, where 91% of local districts with this crop was under threat of drought. There is a very high risk in Opolskie, Mazowieckie and Łódzkie (in more than 80% of local districts). Detailed data on this crop are presented in Table 6.
Table 6. The threat of agricultural drought for ground vegetables cultivation
| No. | Voivodeship | Number of local districts | Number of local districts at risk | The share of local districts under risk [%] | The share of arable land under risk [%] |
|---|---|---|---|---|---|
| 1 | lubelskie | 234 | 213 | 91.0 | 34.9 |
| 2 | opolskie | 103 | 89 | 86.4 | 7.3 |
| 3 | mazowieckie | 364 | 311 | 85.4 | 44.0 |
| 4 | łódzkie | 202 | 163 | 80.7 | 27.6 |
| 5 | świętokrzyskie | 128 | 87 | 68.0 | 8.5 |
| 6 | podlaskie | 141 | 79 | 56.0 | 15.6 |
| 7 | dolnośląskie | 224 | 56 | 25.0 | 1.5 |
| 8 | śląskie | 189 | 37 | 19.6 | 1.7 |
| 9 | podkarpackie | 189 | 29 | 15.3 | 2.0 |
| 10 | wielkopolskie | 316 | 24 | 7.6 | 1.1 |
| 11 | kujawsko-pomorskie | 179 | 1 | 0.6 | 0.0 |
| 12 | małopolskie | 225 | 1 | 0.4 | 0.0 |
| Polska | 3064 | 1090 | 35.6 | 12.6 |
Drought risk for maize for silage occurs on soils category I and II. Drought for this cultivation occurs 11 voivodeships 1087 local districts (35,5% of local districts in the country) on 8.3 % of the arable land. The greatest risk occurs in voivodeships : lubelskim, where 92.3% of local districts with this crop was under threat of drought. There is a very high risk in Opolskie, Mazowieckie and Łódzkie (in more than 80% of local districts). Detailed data on this crop are presented in Table 7.
Table 7. The threat of agricultural drought for ground vegetables cultivation
| No. | Voivodeship | Number of local districts | Number of local districts at risk | The share of local districts under risk [%] | The share of arable land under risk [%] |
|---|---|---|---|---|---|
| 1 | lubelskie | 234 | 216 | 92.3 | 22.2 |
| 2 | opolskie | 103 | 91 | 88.3 | 12.3 |
| 3 | mazowieckie | 364 | 309 | 84.9 | 25.6 |
| 4 | łódzkie | 202 | 160 | 79.2 | 20.4 |
| 5 | świętokrzyskie | 128 | 86 | 67.2 | 5.8 |
| 6 | podlaskie | 141 | 78 | 55.3 | 9.1 |
| 7 | dolnośląskie | 224 | 59 | 26.3 | 2.6 |
| 8 | śląskie | 189 | 36 | 19.0 | 2.7 |
| 9 | podkarpackie | 189 | 27 | 14.3 | 1.2 |
| 10 | wielkopolskie | 316 | 24 | 7.6 | 1.2 |
| 11 | małopolskie | 225 | 1 | 0.4 | 0.0 |
| Polska | 3064 | 1087 | 35.5 | 8.3 |
Drought risk for sugar beet occurs on soils category II and III. Drought for this cultivation occurs 9 voivodeships 659 local districts (21.5% of local districts in the country) on 5.6 % of the arable land. The greatest risk occurs in voivodeships : Lubelskie and Mazowieckie, where 76.9% and 73.6% respectively of local districts with this crop was under threat of drought. Detailed data on this crop are presented in Table 8.
Table 8. The threat of agricultural drought for sugar beet cultivation
| No. | Voivodeship | Number of local districts | Number of local districts at risk | The share of local districts under risk [%] | The share of arable land under risk [%] |
|---|---|---|---|---|---|
| 1 | lubelskie | 234 | 180 | 76.9 | 20.6 |
| 2 | mazowieckie | 364 | 268 | 73.6 | 21.4 |
| 3 | łódzkie | 202 | 89 | 44.1 | 9.2 |
| 4 | opolskie | 103 | 35 | 34.0 | 1.4 |
| 5 | podlaskie | 141 | 41 | 29.1 | 4.9 |
| 6 | świętokrzyskie | 128 | 27 | 21.1 | 1.7 |
| 7 | dolnośląskie | 224 | 11 | 4.9 | 0.2 |
| 8 | śląskie | 189 | 7 | 3.7 | 0.1 |
| 9 | podkarpackie | 189 | 1 | 0.5 | 0.0 |
| Polska | 3064 | 659 | 21.5 | 5.6 |
Drought risk for fruit trees occurs on soils category I and II. Drought for this cultivation occurs 9 voivodeships 651 local districts (21.2% of local districts in the country) on 6.0 % of the arable land. The greatest risk occurs in voivodeships : Lubelskie and Mazowieckie, where 74.8% and 74.5% respectively of local districts with this crop was under threat of drought. Detailed data on this crop are presented in Table 9.
Table 9. The threat of agricultural drought for fruit trees cultivation
| No. | Voivodeship | Number of local districts | Number of local districts at risk | The share of local districts under risk [%] | The share of arable land under risk [%] |
|---|---|---|---|---|---|
| 1 | lubelskie | 234 | 175 | 74.8 | 19.2 |
| 2 | mazowieckie | 364 | 271 | 74.5 | 22.1 |
| 3 | łódzkie | 202 | 90 | 44.6 | 12.0 |
| 4 | opolskie | 103 | 31 | 30.1 | 0.9 |
| 5 | podlaskie | 141 | 41 | 29.1 | 7.5 |
| 6 | świętokrzyskie | 128 | 27 | 21.1 | 2.8 |
| 7 | dolnośląskie | 224 | 9 | 4.0 | 0.1 |
| 8 | śląskie | 189 | 6 | 3.2 | 0.1 |
| 9 | podkarpackie | 189 | 1 | 0.5 | 0.0 |
| Polska | 3064 | 651 | 21.2 | 6.0 |
Drought risk for grain maize occurs on soils category II. Drought for this cultivation occurs 2 voivodeships 203 local districts (6.6% of local districts in the country) on 1.8 % of the arable land. The greatest risk occurs in Lubelskie voivodeships, where 46.6% of local districts with this crop was under threat of drought. Detailed data on this crop are presented in Table 10.
Table 10. The threat of agricultural drought for fruit trees cultivation
| No. | Voivodeship | Number of local districts | Number of local districts at risk | The share of local districts under risk [%] | The share of arable land under risk [%] |
|---|---|---|---|---|---|
| 1 | lubelskie | 234 | 109 | 46.6 | 12.7 |
| 2 | mazowieckie | 364 | 94 | 25.8 | 5.0 |
| Polska | 3064 | 203 | 6.6 | 1.8 |
As in the previous reporting period, also in the ninth reporting period, i.e. from 21 June to 20 August 2015, an area particularly vulnerable to water deficit is still Lublin region. In this area listed water shortage was ranging from -200 to -249 mm (in the northern parts of the region).
Still very low values of climatic water balance are also found in the southern areas of the Mazowsze region. CWB values in these areas ranged from -230 to -239 mm. Continued low values CWB occurred in the eastern part of the Łodzkie and in the central regions of Mazowieckie, ranged from -220 to -229 mm.
Still very low values of climatic water balance were also found in the northern areas of the Świętokrzyskie voivodeship, western parts of Łódzkie, northern parts of Mazowieckie and Podlaskie , southern parts of Lubelskie and Opolskie and in central part of Dolnośląskie voivodeship have ranged from -200 to -219 mm.
We inform that on the basis of the existing in 2015 “Regulation of the Minister of Agriculture and Rural Development on the value of climatic water balance (CWB)”, meaning the occurrence of drought for selected groups and crop species and soil categories during the growing season, and the designated critical values CWB, meaning the occurrence 20% yields reduction at local district scale in a given year as compared to yields obtained during multiannual averages of weather conditions, found so far the threat of drought during the growing season in 2015 on Polish territory among 14 groups and plant species:
- Spring cereals
- Winter cereals
- Shrubs
- Strawberries
- Legumes
- Rape and turnip rape
- Tobacco
- Ground vegetables
- Potato
- Hops
- Silage maize
- Grain maize
- Sugar beet
- Fruit trees
The total number of local districts threatened by drought this year in Poland and the participation of local district at risk (in%) Table presents. 11.
Table 11. Total number of local districts threatened by drought this year in Poland (%)
| Lp. | Cultivar | Number of local districts at drought risk | The share of number of local districts at drought risk in Poland[w %] |
|---|---|---|---|
| 1 | Legumes | 2952 | 96.3 |
| 2 | Potato | 2697 | 88.0 |
| 3 | Fruit shrubs | 2697 | 88.0 |
| 4 | Hops | 1578 | 51.5 |
| 5 | Tobacco | 1091 | 35.6 |
| 6 | Ground vegetables | 1090 | 35.6 |
| 7 | Spring cereals | 1087 | 35.5 |
| 8 | Silage maize | 1014 | 33.1 |
| 9 | Fruit trees | 659 | 21.5 |
| 10 | Sugar beet | 651 | 21.2 |
| 11 | Strawberries | 546 | 17.8 |
| 12 | Winter cereals | 521 | 17.0 |
| 13 | Grain maize | 203 | 6.6 |
| 14 | Rape and turnip rape | 111 | 3.6 |
A potential area under agricultural drought risk in 2015 in Poland are presented in Table 12.
Table 12. The potential area under agricultural drought risk in 2015
| Lp. | Cultivar | The area of drought risk [%] | The area drought risk [ha)]* |
|---|---|---|---|
| 1 | Legumes | 52.4 | 7 390 333 |
| 2 | Potato | 53.3 | 7 517 266 |
| 3 | Fruit shrubs | 53.3 | 7 517 266 |
| 4 | Hops | 19.2 | 2 707 908 |
| 5 | Tobacco | 14.3 | 2 016 828 |
| 6 | Ground vegetables | 12.6 | 1 777 065 |
| 7 | Spring cereals | 10.7 | 1 510 000 |
| 8 | Silage maize | 8.3 | 1 170 606 |
| 9 | Fruit trees | 6.0 | 846 221 |
| 10 | Sugar beet | 5.6 | 789 806 |
| 11 | Strawberries | 5.2 | 733 392 |
| 12 | Winter cereals | 4.2 | 592 355 |
| 13 | Grain maize | 1.8 | 253 866 |
| 14 | Rape and turnip rape | 0.8 | 112 830 |
* The area of arable land and orchards by the Statistical Yearbook of Agriculture, 2014 arable land: 13 818 287 hectares, 285 402 hectares of orchards, total 14 103 689 ha
We inform that each water deficit reduces the crops yield. The shortage of water is greater and the longer it takes, the yield reduction is higher. The occurrence of critical CWB value means the average yield reduction in the local district scale by 20% in a given year as compared to the yield obtained with the multi-annual average weather conditions. So, if IUNG-PIB announces the occurrence of agricultural drought, this means that the final yields in a given local district for the cultivation of which thresholds were exceeded, will be lower by 20% in a given year as compared to the yield obtained with the multi-annual average weather conditions. Very often it happens that the value of CWB are close to critical values, but they are not exceeded, it means that the average loss in yield in the local district does not exceed 20%. However, it should be noted that in this case in the individual households the yield losses can be as high as 30-40%. It should also be noted that in the case of reporting, that the drought has not occurred within the meaning of the Act, it should be stressed that any shortage of water for crops results in a reduction in crop yields and that drought occurred in the area, causing a loss in a farm depending on its severity. Estimated value in the amount of yield losses on a scale of local district, do not rule out that the losses on the farm could be even more than 25-30%. The local soil and climatic conditions of specific fields may in fact differ from the modeling results on a large scale (local district) and the amount of losses in a particular field may specify a specially appointed committee, whose purpose should be to verify the effects of drought in the area (local district).
In July, there have been very similar distribution of air temperature on Polish territory as in June. The lowest air temperature was recorded in the northern and north - eastern parts of the country. In contrast, the highest temperature was recorded in the south-western areas. In the northern regions of the country was recorded a temperature even below 17.0 degrees. In the southern areas of the Pomorskie Lakeland, Mazurskie Lakeland, Podlaska Lowland it was also chilly with temperatures ranging from 17 °C to 18 °C. At the Highlands and Lowlands of Poland recorded a high temperature of 18 °C to 20 °C. In contrast, the highest temperature (above 20 °C) was recorded in southern areas of the Śląska Lowland and the Karpaty Foothills, in some parts of the area were recorded even above 21 ° C.
The temperature distribution in the first ten days of August did not deviate from its distribution in June and July. Coldest, still was on the Embankment, in the northern part of the Pomorskie Lake District and Żuławy, below 21 ° C. In the southern parts of the Pomorskie Lake District, and in the area of the Mazurskie Lake District recorded a temperature of 21 to 23 ° C. The warmest it was the Śląska Lowland from 24.5 to over 25 ° C. In the rest of the country recorded from 23 to 24.5 ° C.
The second ten days of August in Poland was also very warm. The hottest was in the western part of the country with air temperature of over 23 ° C. For many areas in Poland also it was very warm (20 to 23 ° C). Only slightly cooler was in the north-eastern part of the country with air temperature of below 20 ° C.
In July precipitation occurred in five main stripes, three of which were characterized by a relatively high rainfall from 70 to 100 mm, and two of them precipitation smaller - amounting to as low as less than 30 to 70 mm. Higher rainfall (above 70 mm) occurred on the Baltic coast, in northern regions of the Pomorskie Lake District, on Ziemia Lubuska, Wielkopolskie and Mazurskie Lakeland and south-eastern Poland. In contrast, areas with less rainfall (less than 70 mm) were in the southern regions of the Pomorskie Lake District, and Plains: Wielkopolska, Śląska, Mazowiecka, Podlaska and Wyżyny Polskie
The first ten days of August was characterised by a very different precipitation and on a large area was even an lack of them or too small instance. An area with very low rainfall (less than 2 mm) was Lowlands: Szczecińska, Śląska, Mazowiecka, Podlaska and Lubelska. Only slightly more rainfall occurred in the lake districts: Pomorskie, Wielkopolskie and also on the Polish Highlands and in the Beskidy Mountains from 2 to 20 mm in some places up to 40 mm.
In the second ten days of August rainfalls were very small. Particularly low or even their absence was reported in the eastern part of the country. By contrast, slightly more was reported in the western part of the country from 5 to 40 mm, and in some places were locally higher rainfall origin of the storm.
Reports
- Report 13 (1.VIII - 30.IX) +
- Report 12 (21.VII - 20.IX) +
- Report 11 (11.VII - 10.IX) +
- Report 10 (1.VII - 31.VIII) +
- Report 09 (21.VI - 20.VIII) +
- Report 08 (11.VI - 10.VIII) +
- Report 07 (1.VI - 31.VII)
- Report 06 (21.V - 20.VII)
- Report 05 (11.V - 10.VII) +
- Report 04 (1.V - 30.VI) +
- Report 03 (21.IV - 20.VI) +
- Report 02 (11.IV - 10.VI) +
- Report 01 (1.IV - 31.V)