ARCHIVES (2015)
Do roku 2016 raport oznaczony numerem 1 był tworzony za okres od 1 kwietnia do 31 maja. Od roku 2017 analizy są wykonywane o dekadę wcześniej czyli 1 raport oznacza okres od 21 marca do 20 maja
Communication report regarding the incidences of drought conditions in Poland
Year: 2015; period: 05 (11.V - 10.VII)
The Institute of Soil Science and Plant Cultivation - State Research Institute in accordance with an Act from the Minister of Agriculture and Rural Development has developed the climatic water balance for all Polish municipalities (3,064 municipalities), and based on the soils categories have identified in those municipalities the current agricultural drought risk for the following crops: winter and spring cereals, corn for grain and silage, oilseed rape and turnip rape, sugar beet, potatoes, hops, tobacco, field vegetables, shrubs and fruit trees and strawberries and legumes.
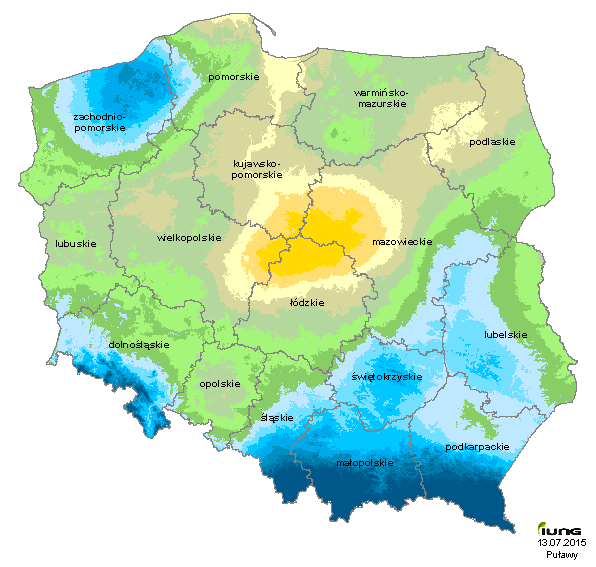
In the fifth reporting period, i.e. from May 11 to July 10, 2015, IUNG-PIB state a risk of agricultural drought in Poland. The values of climatic water balance (CWB), which are the basis to assess the risk of drought, are negative over the entire range Poland.
In the current sixty days period threat to agricultural drought is listed among crops:
- spring cereals,
- winter cereals,
- oilseed rape and turnip rape,
- tobacco,
- field vegetables,
- shrubs and fruit trees,
- strawberries,
- legumes.
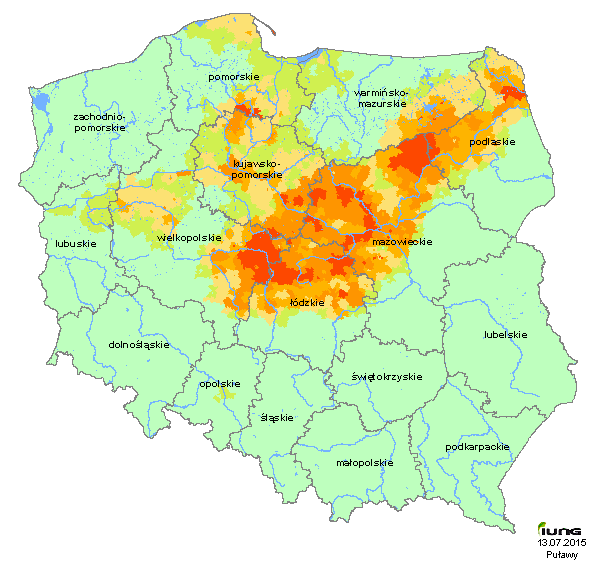
The biggest threat of drought in Poland occurs for spring cereals. Drought for the crop occurs in soils:
- I category (very light soil, granulometric group: sand
- II category (light soil, granulometric group: loamy sand)
The threat of drought for spring cereals is present in four voivodeships in 860 local districts (28.1% of Polish local districts), on 10.7 % of Polish arable land.
Table 1 contains detailed data on the number of local districts and % of local districts and area of arable land for Voivodeships where there is drought risk for the cultivation of spring cereals.
|
No. |
Voivodeship |
Number of local districts at risk |
Number of local district at risk |
The share of area at draught risk [%] |
Share of area risk [%] |
|
1 |
kujawsko-pomorskie |
179 |
161 |
89.9 |
21.3 |
|
2 |
łódzkie |
202 |
126 |
62.4 |
32.6 |
|
3 |
pomorskie |
140 |
83 |
59.3 |
5.4 |
|
4 |
mazowieckie |
364 |
200 |
54.9 |
28.2 |
|
5 |
podlaskie |
141 |
75 |
53.2 |
16.3 |
|
6 |
wielkopolskie |
316 |
146 |
46.2 |
16.4 |
|
7 |
warmińsko-mazurskie |
149 |
56 |
37.6 |
4.9 |
|
8 |
lubuskie |
116 |
10 |
8.6 |
0.3 |
|
9 |
opolskie |
103 |
3 |
2.9 |
0.0 |
Drought risk for legumes occurs of considered sixty days period on soils category I and II. It is present in 218 local districts (7.1% of local districts in the country) on 2.1% of the arable land. The data on these crops is shown in Table 2.
|
No. |
Voivodeship |
Number of local districts at risk |
Number of local district at risk |
The share of area at draught risk [%] |
Share of area risk [%] |
|
1 |
łódzkie |
202 |
61 |
30.2 |
8.9 |
|
2 |
mazowieckie |
364 |
83 |
22.8 |
6.8 |
|
3 |
kujawsko-pomorskie |
179 |
38 |
21.2 |
3.0 |
|
4 |
wielkopolskie |
316 |
36 |
11.4 |
3.6 |
Drought risk for winter wheat occurs of considered sixty days period on soils category I. It is present in 110 local districts (3.6% of local districts in the country) on 0.8% of the arable land. The data on these crops is shown in Table 3
|
No. |
Voivodeship |
Number of local districts at risk |
Number of local district at risk |
The share of area at draught risk [%] |
Share of area risk [%] |
|
1 |
łódzkie |
202 |
43 |
21.3 |
4.6 |
|
2 |
mazowieckie |
364 |
38 |
10.4 |
2.5 |
|
3 |
kujawsko-pomorskie |
179 |
12 |
6.7 |
0.6 |
|
4 |
wielkopolskie |
316 |
17 |
5.4 |
1.1 |
Drought risk for oilseed rape and turnip rape occurs of considered sixty days period on soils category II. It is present in 110 local districts (3.6% of local districts in the country) on 0.8% of the arable land. The data on these crops is shown in Table 4
|
No. |
Voivodeship |
Number of local districts at risk |
Number of local district at risk |
The share of area at draught risk [%] |
Share of area risk [%] |
|
1 |
łódzkie |
202 |
43 |
21.3 |
4.6 |
|
2 |
mazowieckie |
364 |
38 |
10.4 |
2.5 |
|
3 |
kujawsko-pomorskie |
179 |
12 |
6.7 |
0.6 |
|
4 |
wielkopolskie |
316 |
17 |
5.4 |
1.1 |
Drought risk for shrubs and fruit trees occurs of considered sixty days period on soils category I. It is present in 110 local districts (3.6% of local districts in the country) on 0.8% of the arable land. The data on these crops is shown in Table 5
|
No. |
Voivodeship |
Number of local districts at risk |
Number of local district at risk |
The share of area at draught risk [%] |
Share of area risk [%] |
|
1 |
łódzkie |
202 |
43 |
21.3 |
4.6 |
|
2 |
mazowieckie |
364 |
38 |
10.4 |
2.5 |
|
3 |
kujawsko-pomorskie |
179 |
12 |
6.7 |
0.6 |
|
4 |
wielkopolskie |
316 |
17 |
5.4 |
1.1 |
Drought risk for field vegetables occurs of considered sixty days period on soils category I. It is present in 5 local districts (0.2% of local districts in the country) on 0.002% of the arable land. The data on these crops is shown in Table 6.
|
No. |
Voivodeship |
Number of local districts at risk |
Number of local district at risk |
The share of area at draught risk [%] |
Share of area risk [%] |
|
1 |
mazowieckie |
364 |
5 |
1.4 |
0.01 |
Drought risk for strawberries occurs of considered sixty days period on soils category I. It is present in 5 local districts (0.2% of local districts in the country) on 0.002% of the arable land. The data on these crops is shown in Table 7.
|
No. |
Voivodeship |
Number of local districts at risk |
Number of local district at risk |
The share of area at draught risk [%] |
Share of area risk [%] |
|
1 |
mazowieckie |
364 |
5 |
1.4 |
0.01 |
Drought risk for tobacco occurs of considered sixty days period on soils category I. It is present in 5 local districts (0.2% of local districts in the country) on 0.002% of the arable land. The data on these crops is shown in Table 8.
|
No. |
Voivodeship |
Number of local districts at risk |
Number of local district at risk |
The share of area at draught risk [%] |
Share of area risk [%] |
|
1 |
mazowieckie |
364 |
5 |
1.4 |
0.01 |
The lowest value of CWB occurred in exactly the same areas as in the previous sixty days period. The lowest CWB values were in the central and eastern part of the Wielkopolska Lake District. north-western part of the Lodz Voivodeship. Kutno Plain and Kujawski Lake District, with the proviso that current values were approx. 20 mm below and reaching from -160 to -179 mm. Low values CWB were also recorded in Pomorskie, eastern parts of Warmińsko-Mazurskie, Mazowieckie and Podlaskie Voivodeship reaching from -150 to -169 mm. In some parts of the country CWB value compared to the previous period were lower by 40 mm and up to 50 mm. The large decrease in CWB occurred mainly in the Podlasie region, in the Lublin region and in the northern regions of Malopolska and Podkarpacie..
The highest CWB value (below -50 mm) was recorded in southern parts of Małopolskie and Podkarpackie.
During the current sixty days period. the value of CWB on Polish territory compared to the previous reporting period have significantly decreased. On average for the country CWB value compared to the previous period were lower by 29 mm.
May this year in terms of temperature was relatively low. The highest air temperature occurred in in the south-western part of the Poland. reaching 13-13.5°C. In most parts of the country were recorded temperatures from 12 to 13°C. The coolest was in the north. and in these areas air temperature was from 10 to 12°C.
In June the lowest temperature occurred in the north of the country and the highest in the southern parts of Poland. In the first ten days of June on the Baltic coast and in Żuławy recorded below 15°C. In the Mazury Lake District. Podlasie Lowland. and in the Lubuskie region average air temperature was 15°C. In Polish Highlands, Śląska and Mazowiecka Lowland a temperature was recorded from 16.5°C to 17.5°C. In contrast, the highest temperature (above 17.5°C) was recorded in the Sandomierz Basin and in the vicinity of Krakow and Opole.
In the first ten days of July the lowest air temperature was recorded in the northern and north - eastern parts of the Poland. In contrast, the highest temperature of the month was recorded in the south-western areas of the country. On the Baltic coast and in Żuławy was recorded temperature below 18.5°C. In the southern part of the Pomorskie andMazurskie Lakeland, Podlasie Lowland air temperature ranged from 18.5°C to 19.5°C. On the Polish Highlands recorded a temperature of 19.5°C to 21°C. In contrast, the highest temperature (above 21.5°C) was recorded on Ziemia Lubuska and the Śląska Lowland.
May this year in terms of precipitation was varied. The lowest occurred over a large area in the western and central parts of the country. The lowest rainfall occurred especially in Lubuska region. Wielkopolska and in Kujawy. even less than 20 mm. The further east of these areas. the rainfall values were higher. The highest precipitation was recorded in the Lublin Upland and in the eastern and western Beskidy. in Podhale and Tatry. from 100 to over 220 mm.
Precipitation in June of this year were characterized by a very large diversity in the country. Relatively high precipitation occurred in the south - west and the northern part of the Poland from 60 to 90 mm and sometimes even exceeded 90 mm. By contrast, relatively small and very low rainfall was recorded in eastern and especially in northern eastern and southern eastern parts of the country and in the Central Polish Lowlands waist of less than 20 mm to 40 mm.
In the first ten days of July in most parts of the country were relatively low rainfall (10 to 20 mm). Slightly larger rainfall from 20 to 40 mm occurred in Ziemia Lubuska and in the northern part of the Warmia and Mazury. Greater than 50 mm rainfall was recorded only in the south-eastern parts of the Podkarpackie Voivodeship.
Throughout the country there is still a large deficit of water. The lack of water for crops manifests itself in all monitored crops substantial reduction in yields. It should also be noted that in the sixty days period under consideration there were very high values of evapotranspiration, 225 mm on average for the country and in some places even reaching approx. 250 mm.
Reports
- Report 13 (1.VIII - 30.IX) +
- Report 12 (21.VII - 20.IX) +
- Report 11 (11.VII - 10.IX) +
- Report 10 (1.VII - 31.VIII) +
- Report 09 (21.VI - 20.VIII) +
- Report 08 (11.VI - 10.VIII) +
- Report 07 (1.VI - 31.VII)
- Report 06 (21.V - 20.VII)
- Report 05 (11.V - 10.VII) +
- Report 04 (1.V - 30.VI) +
- Report 03 (21.IV - 20.VI) +
- Report 02 (11.IV - 10.VI) +
- Report 01 (1.IV - 31.V)