ARCHIVES (2018)
Do roku 2016 raport oznaczony numerem 1 był tworzony za okres od 1 kwietnia do 31 maja. Od roku 2017 analizy są wykonywane o dekadę wcześniej czyli 1 raport oznacza okres od 21 marca do 20 maja
Communication report regarding the incidences of drought conditions in Poland
Year: 2018; period: 10 (21.VI - 20.VIII)
The Institute of Soil Science and Plant Cultivation – State Research Institute, in accordance with an Act of the Minister of Agriculture and Rural Development has developed the climatic water balance values for all 2478 Polish local districts (gminas) and, on the basis of soil categories, calculated the current risk of agricultural drought for the following crops: maize for grain and maize for silage, potato, sugar beet, hops, tobacco, ground vegetables, fruit shrubs and trees and legumes (fabacea).
In the tenth reporting period, i.e. from June 21st to August 20th, 2018, IUNG-PIB stated agricultural drought conditions in Poland.
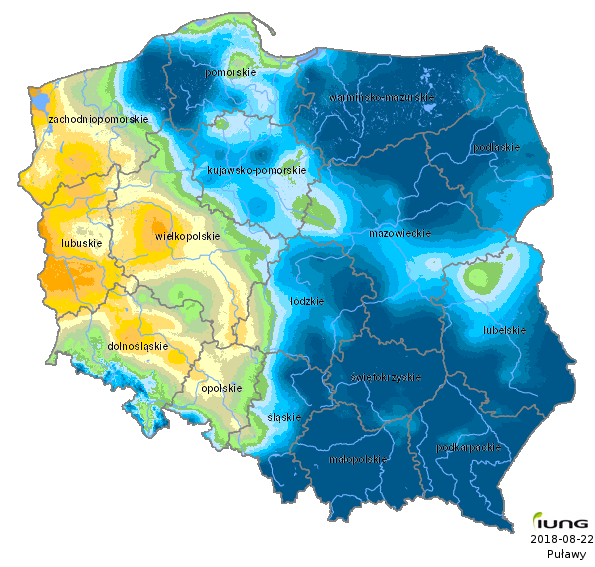
The mean of Climatic Water Balance values, which are the basis for assessing the risk of agricultural drought, was negative and reached -108.0 mm. In relation to the previous reporting period it has risen by 2.2 mm.
In the eastern part of the country the CWB values have risen by 10-20 mm. In the western regions the area with low CWB values has grown. The lowest CWB values were still recorded in Poznań and the surrounding area, and in Lubusz Land, reaching from -190 to -209 mm. Water deficiency ranging from -170 to -189 mm was recorded in Szczecińska Lowland, Zielonogórska Upland, Trzebnickie Hills, Lubin Upland, and Legnicka Plain. In the rest of the country water deficiency ranged from -100 to 169 mm. In the south of Poland water deficiency was lower and ranged from 0 to -100 mm, apart from Wołomińska Plain, where it ranged from -110 to -129 mm.
In the current reporting period drought occurs in the following monitored crops:
- Legumes (fabacea),
- Fruit shrubs,
- Potato,
- Hops,
- Tobacco,
- Ground vegetables,
- Maize for silage,
- Maize for grain,
- Sugar beet.
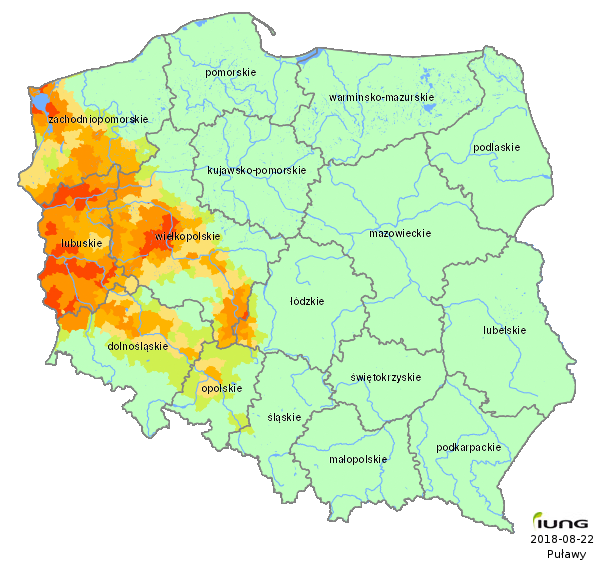
The number of all local districts (gminas) in Poland at risk of agricultural drought (%) is presented in Table 1.
Table 1. Number of local districts (gminas) at risk of agricultural drought and the share of the area at risk in the country (%).
| No. | Crop | Number of local districts (gminas) at risk | Share of local districts (gminas) at risk in Poland [%] |
|---|---|---|---|
| 1. | Legumes (fabacea) | 410 | 16.55 |
| 2. | Fruit shrubs | 329 | 13.28 |
| 3. | Potato | 190 | 7.67 |
| 4. | Hops | 65 | 2.62 |
| 5. | Tobacco | 52 | 2.10 |
| 6. | Ground vegetables | 29 | 1.17 |
| 7. | Maize for silage | 12 | 0.48 |
| 8. | Maize for grain | 2 | 0.08 |
| 9. | Sugar beet | 1 | 0.04 |
The potential area at risk of agricultural drought in Poland is shown in Table 2.
Table 2. The area at risk of agricultural drought according to crops
| No. | Crop | The arable area at risk of agricultural drought [%] |
|---|---|---|
| 1. | Legumes (fabacea) | 6.17 |
| 2. | Fruit shrubs | 4.81 |
| 3. | Potato | 1.49 |
| 4. | Hops | 0.38 |
| 5. | Tobacco | 0.26 |
| 6. | Ground vegetables | 0.15 |
| 7. | Maize for silage | 0.02 |
| 8. | Maize for grain | 0.00 |
| 9. | Sugar beet | 0.00 |
In the tenth reporting period, from June 21st to August 20th 2018, the highest risk of agricultural drought occurred again for legumes (fabacea). In Poland agricultural drought in legumes (fabacea) was recorded in 7 voivodeships, in 410 local districts (gminas), i.e. 16.55% of all the local districts in Poland, in the area of 6.17% of arable land.
In relation to the previous reporting period, the number of local districts as well as the area affected by drought have grown by 7.15% and 4.09%, respectively.
Detailed data on drought occurrence in legumes (fabacea) in particular voivodeships are presented in table 3.
Table 3. Agricultural drought in legumes (fabacea)
| No. | Voivodeship | Number of local districts | Number of local districts at risk | Share of local districts at risk [%] | Share of the area at risk [%] |
|---|---|---|---|---|---|
| 1. | lubuskie | 82 | 82 | 100.00 | 64.06 |
| 2. | wielkopolskie | 226 | 132 | 58.41 | 22.90 |
| 3. | zachodniopomorskie | 114 | 65 | 57.02 | 17.25 |
| 4. | dolnośląskie | 169 | 81 | 47.93 | 9.78 |
| 5. | opolskie | 71 | 34 | 47.89 | 2.97 |
| 6. | łódzkie | 177 | 15 | 8.47 | 2.09 |
| 7. | śląskie | 167 | 1 | 0.60 | 0.00 |
In the current reporting period drought was also recorded for fruit shrubs. It was recorded in 6 voivodeships, in 329 local districts (gminas), i.e. 13.28% of all the local districts in Poland, in the area of 4.81% of arable land. In relation to the previous reporting period, the number of local districts as well as the area affected by drought have grown by 5.21% and 3.08%, respectively.
Detailed data on drought occurrence in fruit shrubs in particular voivodeships are presented in table 4.
Table 4. Agricultural drought in fruit shrubs
| No. | Voivodeship | Number of local districts | Number of local districts at risk | Share of local districts at risk [%] | Share of the area at risk [%] |
|---|---|---|---|---|---|
| 1. | lubuskie | 82 | 82 | 100.00 | 57.46 |
| 2. | zachodniopomorskie | 114 | 56 | 49.12 | 13.36 |
| 3. | wielkopolskie | 226 | 106 | 46.90 | 16.40 |
| 4. | dolnośląskie | 169 | 64 | 37.87 | 7.78 |
| 5. | opolskie | 71 | 11 | 15.49 | 0.97 |
| 6. | łódzkie | 177 | 10 | 5.65 | 1.34 |
In the current reporting period a risk of drought was also recorded for potatoes. In Poland agricultural drought in potatoes was recorded in 4 voivodeships, in 190 local districts (gminas), i.e. w 7.67% of all the local districts in Poland, in the area of 1.49% of arable land. In relation to the previous reporting period, the number of local districts as well as the area affected by drought have grown by 6.02% and 1.25%, respectively.
Detailed data on drought occurrence in potatoes in particular voivodeships are presented in table 5.
Table 5. Agricultural drought in potatoes
| No. | Voivodeship | Number of local districts | Number of local districts at risk | Share of local districts at risk [%] | Share of the area at risk [%] |
|---|---|---|---|---|---|
| 1. | lubuskie | 82 | 71 | 86.59 | 31.15 |
| 2. | zachodniopomorskie | 114 | 39 | 34.21 | 3.22 |
| 3. | dolnośląskie | 169 | 36 | 21.30 | 1.48 |
| 4. | wielkopolskie | 226 | 44 | 19.47 | 2.99 |
In the current reporting period a risk of drought was also recorded for hops. It occurred in 4 voivodeships, in 65 local districts (gminas), i.e. 2.62% of all local districts in the country, in the area of 0.38% of arable land.
Detailed data on drought occurrence in hops in particular voivodeships are presented in table 6
Table 6. Agricultural drought in hops
| No. | Voivodeship | Number of local districts | Number of local districts at risk | Share of local districts at risk [%] | Share of the area at risk [%] |
|---|---|---|---|---|---|
| 1. | lubuskie | 82 | 36 | 43.90 | 10.44 |
| 2. | wielkopolskie | 226 | 16 | 7.08 | 0.67 |
| 3. | zachodniopomorskie | 114 | 8 | 7.02 | 0.13 |
| 4. | dolnośląskie | 169 | 5 | 2.96 | 0.04 |
In the current reporting period a risk of drought was also recorded for tobacco. It occurred in 4 voivodeships, in 52 local districts (gminas), i.e. 2.10% of all local districts in the country, in the area of 0.26% of arable land.
Detailed data on drought occurrence in tobacco in particular voivodeships are presented in table 7.
Table 7. Agricultural drought in tobacco
| No. | Voivodeship | Number of local districts | Number of local districts at risk | Share of local districts at risk [%] | Share of the area at risk [%] |
|---|---|---|---|---|---|
| 1. | lubuskie | 82 | 30 | 36.59 | 7.44 |
| 2. | zachodniopomorskie | 114 | 7 | 6.14 | 0.07 |
| 3. | wielkopolskie | 226 | 12 | 5.31 | 0.40 |
| 4. | dolnośląskie | 169 | 3 | 1.78 | 0.00 |
In the current reporting period a risk of drought was also recorded for ground vegetables. It occurred in 3 voivodeships, in 29 local districts (gminas), i.e. 1.17% of all local districts in the country, in the area of 0.15% of arable land.
Detailed data on drought occurrence in ground vegetables in particular voivodeships are presented in table 8.
Table 8. Agricultural drought in ground vegetables
| No. | Voivodeship | Number of local districts | Number of local districts at risk | Share of local districts at risk [%] | Share of the area at risk [%] |
|---|---|---|---|---|---|
| 1. | lubuskie | 82 | 22 | 26.83 | 4.67 |
| 2. | wielkopolskie | 226 | 5 | 2.21 | 0.13 |
| 3. | zachodniopomorskie | 114 | 2 | 1.75 | 0.03 |
Agricultural drought occurred also in maize for silage. It was recorded in 2 voivodeships, in 12 local districts (gminas), i.e. 0.48% of all local districts in the country, in the area of 0.02% of arable land.
Detailed data on drought occurrence in maize for silage in particular voivodeships are presented in table 9.
Table 9. Agricultural drought in maize for silage
| No. | Voivodeship | Number of local districts | Number of local districts at risk | Share of local districts at risk [%] | Share of the area at risk [%] |
|---|---|---|---|---|---|
| 1. | lubuskie | 82 | 11 | 13.41 | 0.68 |
| 2. | zachodniopomorskie | 114 | 1 | 0.88 | 0.00 |
Agricultural drought occurred also in maize for grain, in 2 local districts (gminas) in lubuskie voivodeship, i.e. 0.08% of all local districts in the country.
Detailed data on drought occurrence in maize for grain are presented in table 10.
Table 10. Agricultural drought in maize for grain
| No. | Voivodeship | Number of local districts | Number of local districts at risk | Share of local districts at risk [%] | Share of the area at risk [%] |
|---|---|---|---|---|---|
| 1. | lubuskie | 82 | 2 | 2.44 | 0.10 |
Agricultural drought occurred also in sugar beet, in 1 local district (gminas) in lubuskie voivodeship, i.e. 0.04% of all local districts in the country.
Detailed data on drought occurrence in sugar beet are presented in table 11.
Table 11. Agricultural drought in sugar beet
| No. | Voivodeship | Number of local districts | Number of local districts at risk | Share of local districts at risk [%] | Share of the area at risk [%] |
|---|---|---|---|---|---|
| 1. | lubuskie | 82 | 1 | 1.22 | 0.02 |
July was very warm in the majority of areas in Poland, with temperatures ranging from 18°C to 20°C and exceeding the multiannual norm by more than 2°C. The lowest temperatures were recorded in the north and the south of the country, reaching 16-18°C but also exceeding the norm, by 1-2°C.
The first decade of August was very warm, particularly in Lubusz Land, where temperatures reached from 25 to more than 25.5°C. The further to the east the lower was the temperature, reaching 22°C in the eastern part of the country. In the second decade of the month in was slightly colder. In the south-western part of the country temperatures reached from 20 to 22°C. The lowest temperatures were recorded in the north-eastern Poland, ranging from 18 to 19.5°C.
In July precipitation was very intense, at times exceeding 200 mm. Particularly intense rainfalls occurred in the eastern part of the country, ranging from 100 to 200 mm and constituting from 100 to more than 200% of the norm there. Only in the south-western regions precipitation was less intense, below 50 mm and constituting 70-80% of the multiannual norm. and south-eastern regions it was more intense, ranging from 10 to more than 50 mm.
In the first and second decade of August precipitation varied across the country. In some regions it did not exceed 5 mm, in some there was complete absence of rainfalls. The largest area with very scarce precipitation was in the western part of the country and, to a lesser extent, in the eastern regions, whilst the highest precipitation values (from 20-30 to more than 50 mm) were recorded in Lesser Poland Upland and Silesian Beskid (in the first decade) and in the south-eastern and north-eastern Poland (in the second decade).
July was characterised by high temperatures and intense precipitation at the same time (apart from the south of Poland). In the first decade of August temperatures were very high, but dropped slightly in the second decade of the month. Precipitation distribution in that period varied across the country. The mean CWB value slightly rose, but a considerable decrease in CWB values occurred in the western part of Poland, whilst an increase occurred in the eastern regions.
Weather conditions in the monitored period have caused an increase of water deficiency in the western part of the country, which led to a growing number of crops affected by drought (increase from 8 to 9 in relation to the previous reporting period). The number of local districts (gminas) affected has also risen from 178 to 410 and the area has grown by 4.09% with water deficiency leading to yield reduction by at least 20% in relation to the yield obtained in average weather conditions. In this reporting period, particularly adverse weather conditions causing agricultural drought occurred in lubuskie, wielkopolskie, zachodniopomorskie and dolnośląskie voivodeships.
Executive Director
Prof. dr hab. Wiesław Aleksander Oleszek
Report prepared by:
Dr hab. Andrzej Doroszewski, prof. nadaw.
Dr hab. Rafał Pudełko
Dr Katarzyna Żyłowska
Mgr Piotr Koza
Mgr Elżbieta Wróblewska
Reports
- Report 14 (1.VIII - 30.IX) +
- Report 13 (21.VII - 20.IX) +
- Report 12 (11.VII - 10.IX) +
- Report 11 (1.VII - 31.VIII) +
- Report 10 (21.VI - 20.VIII) +
- Report 09 (11.VI - 10.VIII) +
- Report 08 (1.VI - 31.VII) +
- Report 07 (21.V - 20.VII) +
- Report 06 (11.V - 10.VII) +
- Report 05 (1.V - 30.VI) +
- Report 04 (21.IV - 20.VI) +
- Report 03 (11.IV - 10.VI) +
- Report 02 (1.IV - 31.V) +
- Report 01 (21.III - 20.V)