ARCHIVES (2018)
Do roku 2016 raport oznaczony numerem 1 był tworzony za okres od 1 kwietnia do 31 maja. Od roku 2017 analizy są wykonywane o dekadę wcześniej czyli 1 raport oznacza okres od 21 marca do 20 maja
Communication report regarding the incidences of drought conditions in Poland
Year: 2018; period: 02 (1.IV - 31.V)
The Institute of Soil Science and Plant Cultivation – State Research Institute, in accordance with an Act of the Minister of Agriculture and Rural Development has developed the climatic water balance values for all 2478 Polish local districts (gminas) and, on the basis of soil categories, calculated the current risk of agricultural drought for the following crops: winter and spring cereals, rape and turnip rape, sugar beet, fruit shrubs and trees, and strawberries.
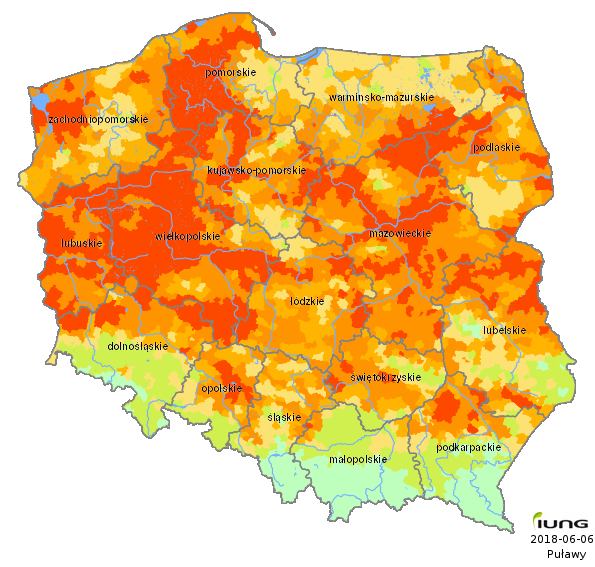
In the second reporting period, i.e. from April 1st to May 31st 2018, IUNG-PIB stated agricultural drought conditions in Poland.
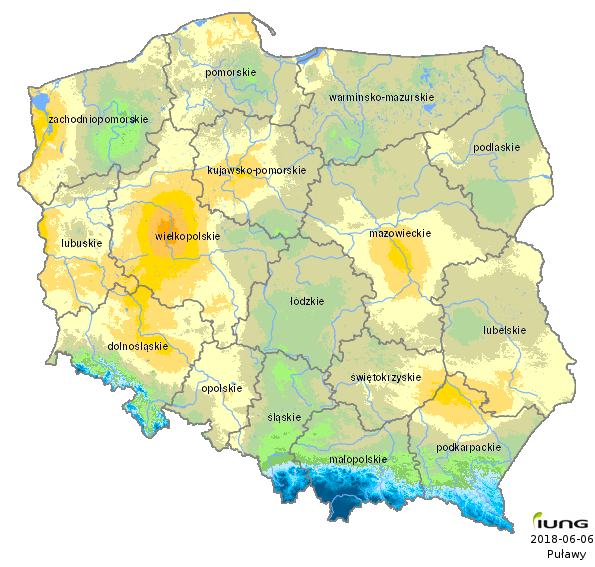
The mean of Climatic Water Balance values, which are the basis for assessing the risk of agricultural drought, was negative and reached -90 mm. In relation to the previous reporting period it has dropped by 21 mm. The lowest CWB values in this sixty-day reporting period were recorded in Poznań and the neighbouring areas, ranging from -200 to -209 mm. A considerable water deficiency was recorded in the Lowlands: Wielkopolska, Szczecińska, Mazowiecka, Greater Poland Lake District, in the region of Lubusz Land and Sandomierska Basin. Water deficiency exceeding 150 mm was recorded in the majority of the country.
In the current reporting period drought occurs in the following crops:
- spring cereal,
- winter cereal,
- strawberries,
- fruit shrubs,
- fruit trees.
The number of all local districts (gminas) in Poland at risk of agricultural drought (%) is presented in Table 1.
Table 1. Number of local districts (gminas) at risk of agricultural drought and the share of the area at risk in the country (%)
| No. | Crop | Number of local districts (gminas) at risk | Share of local districts (gminas) at risk in Poland [%] |
|---|---|---|---|
| 1. | Spring cereals | 2285 | 92.20 |
| 2. | Winter cereals | 2221 | 89.30 |
| 3. | Strawberries | 2198 | 88.70 |
| 4. | Fruit shrubs | 2198 | 88.70 |
| 5. | Fruit trees | 580 | 23.41 |
The potential area at risk of agricultural drought in Poland is shown in Table 2.
Table 2. The area at risk of agricultural drought according to crops
| No. | Crop | The arable area at risk of agricultural drought [%] |
|---|---|---|
| 1. | Spring cereal | 48.90 |
| 2. | Strawberries | 39.30 |
| 3. | Fruit shrubs | 39.30 |
| 4. | Winter cereal | 37.28 |
| 5. | Fruit trees | 4.87 |
In the second reporting period from April 1st to May 31st 2018 the highest risk of agricultural drought occurred for spring cereals. In Poland agricultural drought occurred in all voivodeships, 10 of them recorded drought in all the local districts (gminas). Drought occurred in 2285 local districts (gminas) i.e. 92.21% of all the local districts in Poland, in the area of 48.90% of arable land. Particularly large areas affected by drought were in lubuskie, wielkopolskie and mazowieckie voivodeships. Table 3 presents detailed data on drought occurrence in particular voivodeshpis.
Table 3. Agricultural drought in spring cereals
| No. | Voivodeship | Number of local districts | Number of local districts at risk | Share of local districts at risk [%] | Share of the area at risk [%] |
|---|---|---|---|---|---|
| 1. | kujawsko-pomorskie | 144 | 144 | 100.00 | 56.82 |
| 2. | lubuskie | 82 | 82 | 100.00 | 80.00 |
| 3. | łódzkie | 177 | 177 | 100.00 | 53.95 |
| 4. | mazowieckie | 314 | 314 | 100.00 | 68.10 |
| 5. | opolskie | 71 | 71 | 100.00 | 31.11 |
| 6. | podlaskie | 118 | 118 | 100.00 | 49.15 |
| 7. | świętokrzyskie | 102 | 102 | 100.00 | 40.64 |
| 8. | warmińsko-mazurskie | 116 | 116 | 100.00 | 32.40 |
| 9. | wielkopolskie | 226 | 226 | 100.00 | 79.66 |
| 10. | zachodniopomorskie | 114 | 114 | 100.00 | 50.55 |
| 11. | pomorskie | 123 | 120 | 97.56 | 55.12 |
| 12. | lubelskie | 213 | 207 | 97.18 | 40.65 |
| 13. | dolnośląskie | 169 | 151 | 89.35 | 31.15 |
| 14. | podkarpackie | 160 | 119 | 74.38 | 22.89 |
| 15. | śląskie | 167 | 124 | 74.25 | 28.98 |
| 16. | małopolskie | 182 | 100 | 54.95 | 5.82 |
In the current reporting period there was a particularly high risk of agricultural drought for strawberries, recorded in all the voivodeships, in 8 of them reaching 100% of the local districts (gminas). In Poland agricultural drought occurred in 2198 local districts (gminas) i.e. 88.70% of all local districts in the country, in the area of 39.30% of arable land. Particularly large areas affected by drought were in lubuskie, wielkopolskie and mazowieckie voivodeships. Table 4 presents detailed data on drought occurrence in particular voivodeshpis.
Table 4. Agricultural drought in strawberries
| No. | Voivodeship | Number of local districts | Number of local districts at risk | Share of local districts at risk [%] | Share of the area at risk [%] |
|---|---|---|---|---|---|
| 1. | kujawsko-pomorskie | 144 | 144 | 100.00 | 43.03 |
| 2. | lubuskie | 82 | 82 | 100.00 | 74.55 |
| 3. | łódzkie | 177 | 177 | 100.00 | 39.45 |
| 4. | mazowieckie | 314 | 314 | 100.00 | 55.66 |
| 5. | opolskie | 71 | 71 | 100.00 | 26.38 |
| 6. | podlaskie | 118 | 118 | 100.00 | 39.37 |
| 7. | warmińsko-mazurskie | 116 | 116 | 100.00 | 22.49 |
| 8. | wielkopolskie | 226 | 226 | 100.00 | 72.45 |
| 9. | świętokrzyskie | 102 | 101 | 99.02 | 31.85 |
| 10. | pomorskie | 123 | 120 | 97.56 | 40.67 |
| 11. | zachodniopomorskie | 114 | 111 | 97.37 | 35.40 |
| 12. | lubelskie | 213 | 207 | 97.18 | 30.63 |
| 13. | dolnośląskie | 169 | 141 | 83.43 | 29.08 |
| 14. | podkarpackie | 160 | 101 | 63.12 | 20.83 |
| 15. | śląskie | 167 | 102 | 61.08 | 17.26 |
| 16. | małopolskie | 182 | 67 | 36.81 | 3.15 |
A considerable risk of agricultural drought occurred also for winter cereals, recorded in all the voivodeships, in 8 of them reaching 100% of the local districts (gminas). In Poland agricultural drought occurred in 2221 local districts (gminas) ie. 89.63% of all local dirsticts in the country, in the area of 37.28% of arable land. Particularly large areas affected by drought were in lubuskie, wielkopolskie and mazowieckie voivodeships. Table 5 presents detailed data on drought occurrence in particular voivodeshpis.
Table 5. Agricultural drought in winter cereals
| No. | Voivodeship | Number of local districts | Number of local districts at risk | Share of local districts at risk [%] | Share of the area at risk [%] |
|---|---|---|---|---|---|
| 1. | kujawsko-pomorskie | 144 | 144 | 100.00 | 38.92 |
| 2. | lubuskie | 82 | 82 | 100.00 | 71.70 |
| 3. | łódzkie | 177 | 177 | 100.00 | 40.32 |
| 4. | mazowieckie | 314 | 314 | 100.00 | 50.54 |
| 5. | opolskie | 71 | 71 | 100.00 | 24.52 |
| 6. | podlaskie | 118 | 118 | 100.00 | 38.06 |
| 7. | warmińsko-mazurskie | 116 | 116 | 100.00 | 22.81 |
| 8. | wielkopolskie | 226 | 226 | 100.00 | 70.54 |
| 9. | świętokrzyskie | 102 | 101 | 99.02 | 30.10 |
| 10. | zachodniopomorskie | 114 | 112 | 98.25 | 33.10 |
| 11. | pomorskie | 123 | 120 | 97.56 | 36.64 |
| 12. | lubelskie | 213 | 207 | 97.18 | 26.08 |
| 13. | dolnośląskie | 169 | 142 | 84.02 | 28.35 |
| 14. | śląskie | 167 | 114 | 68.26 | 20.99 |
| 15. | podkarpackie | 160 | 104 | 65.00 | 20.42 |
| 16. | małopolskie | 182 | 73 | 40.11 | 3.61 |
A high risk of agricultural drought occurred also for fruit shrubs, recorded in all the voivodeships, in 8 of them reaching 100% of the local districts (gminas). In Poland agricultural drought occurred in 2198 local districts (gminas) ie. 88.70% of all local districts in the country, in the area of 39.29% of arable land. Particularly large areas affected by drought were in lubuskie, wielkopolskie and mazowieckie voivodeships. Table 6 presents detailed data on drought occurrence in particular voivodeshpis.
Table 6. Agricultural drought in fruit shrubs
| No. | Voivodeship | Number of local districts | Number of local districts at risk | Share of local districts at risk [%] | Share of the area at risk [%] |
|---|---|---|---|---|---|
| 1. | kujawsko-pomorskie | 144 | 144 | 100.00 | 43.03 |
| 2. | lubuskie | 82 | 82 | 100.00 | 74.55 |
| 3. | łódzkie | 177 | 177 | 100.00 | 39.45 |
| 4. | mazowieckie | 314 | 314 | 100.00 | 55.66 |
| 5. | opolskie | 71 | 71 | 100.00 | 26.38 |
| 6. | podlaskie | 118 | 118 | 100.00 | 39.37 |
| 7. | warmińsko-mazurskie | 116 | 116 | 100.00 | 22.49 |
| 8. | wielkopolskie | 226 | 226 | 100.00 | 72.32 |
| 9. | świętokrzyskie | 102 | 101 | 99.02 | 31.85 |
| 10. | pomorskie | 123 | 120 | 97.56 | 40.67 |
| 11. | zachodniopomorskie | 114 | 111 | 97.37 | 35.40 |
| 12. | lubelskie | 213 | 207 | 97.18 | 30.63 |
| 13. | dolnośląskie | 169 | 141 | 83.43 | 29.08 |
| 14. | podkarpackie | 160 | 101 | 63.12 | 20.83 |
| 15. | śląskie | 167 | 102 | 61.08 | 17.26 |
| 16. | małopolskie | 182 | 67 | 36.81 | 3.15 |
Slightly lower risk of agricultural drought occurred also for fruit trees, recorded in 13 voivodeships, in 580 local districts (gminas) i.e. 23.41% of all local districts in the country, in the area of 4.87% of arable land. Table 6 presents detailed data on drought occurrence in particular voivodeshpis.
Table 7. Agricultural drought in fruit trees
| No. | Voivodeship | Number of local districts | Number of local districts at risk | Share of local districts at risk [%] | Share of the area at risk [%] |
|---|---|---|---|---|---|
| 1. | wielkopolskie | 226 | 153 | 67.70 | 19.62 |
| 2. | lubuskie | 82 | 55 | 67.07 | 19.76 |
| 3. | dolnośląskie | 169 | 75 | 44.38 | 7.78 |
| 4. | kujawsko-pomorskie | 144 | 51 | 35.42 | 4.45 |
| 5. | zachodniopomorskie | 114 | 34 | 29.82 | 3.19 |
| 6. | mazowieckie | 314 | 89 | 28.34 | 4.93 |
| 7. | podkarpackie | 160 | 37 | 23.12 | 7.17 |
| 8. | świętokrzyskie | 102 | 18 | 17.65 | 1.03 |
| 9. | pomorskie | 123 | 21 | 17.07 | 1.27 |
| 10. | opolskie | 71 | 12 | 16.90 | 0.49 |
| 11. | lubelskie | 213 | 29 | 13.62 | 1.39 |
| 12. | warmińsko-mazurskie | 116 | 4 | 3.45 | 0.08 |
| 13. | podlaskie | 118 | 2 | 1.69 | 0.10 |
| 14. | łódzkie | 177 | 0 | 0.00 | 0.00 |
| 15. | małopolskie | 182 | 0 | 0.00 | 0.00 |
| 16. | śląskie | 167 | 0 | 0.00 | 0.00 |
April was warm this year, the temperatures ranged from 9 to more than 14°C. The highest temperatures were recorded in the south (above 14°C), and exceeded the multiannual norm by 6°C. The further to the north, the lower was the temperature: ranging from 8 to 11°C, however, it was still 2-3°C higher than the multiannual norm.
In the first decade of May it was the warmest in the south-eastern part of the country, where the temperatures exceeded 17°C, and the coldest in the north-western regions, where the temperatures ranged from 13 to 14°C. In the second decade of the month the south-eastern regions were the coldest, with temperatures ranging from below 13°C to 14°C. The highest temperatures were recorded in the north, ranging from 15 to more than 16.5°C. The third decade of May was the warmest in the western part of the country, with temperatures exceeding 20°C, while in the south it was slightly lower, 18 to 20°C.
In April particularly low precipitation (below 10 mm) was recorded in the Kraków-Częstochowa and Silesian Uplands. Low precipitation (10-20 mm) was also recorded in Lesser Poland and Masovian Lowlands and in Sandomierska Basin, where they constituted 20-40% of the multiannual norm. Only in the north and east precipitation was more intense, from 40 to 60 mm and constituted 100-140% of the norm. In the vast majority of the country precipitation ranged from 20 to 40 mm, i.e. 40-100% of the norm.
In the first decade of May the most intense precipitation was recorded in the southern regions of the country and in the northern part of the Pomeranian Lake District: from 20 to 40 mm. In the rest of the country it was very low, ranging from 5 (or even less) to 20 mm.
In the second decade of the month precipitation was considerably more intense, particularly in the southern part of the country, ranging from 15 to more than 50 mm. The highest precipitation was recorded in the Kraków-Częstochowa Upland, the southern part of Greater Poland and Masovian Uplands, and in Sandomierska Basin. In the north-western regions of Poland precipitation was scarce, below 5 mm.
In the third decade of May, precipitation was scarce in the vast areas of western Poland, even below 5 mm. Only in the north-eastern part of the country precipitation ranged from 20 to more than 50 mm.
We conclude that both April and May were characterised by very high temperatures and insolation. The values of the abovementioned meteorological factors were higher than multiannual norms. At the same time precipitation in this period was considerably low, which caused the decrease of CWB values meaning there was water deficiency for plants. At the moment considerable water deficiency may reduce the yield of many crops at least by 20% at the local district level in comparison to the yield obtained in average multiannual weather conditions.
Executive Director
Prof. dr. hab. Wiesław Aleksander Oleszek
Report prepared by:
Dr hab. Andrzej Doroszewski, prof. nadw.
Dr hab. Rafał Pudełko
Dr Katarzyna Żyłowska
Mgr Piotr Koza
Mgr Elżbieta Wróblewska
Reports
- Report 14 (1.VIII - 30.IX) +
- Report 13 (21.VII - 20.IX) +
- Report 12 (11.VII - 10.IX) +
- Report 11 (1.VII - 31.VIII) +
- Report 10 (21.VI - 20.VIII) +
- Report 09 (11.VI - 10.VIII) +
- Report 08 (1.VI - 31.VII) +
- Report 07 (21.V - 20.VII) +
- Report 06 (11.V - 10.VII) +
- Report 05 (1.V - 30.VI) +
- Report 04 (21.IV - 20.VI) +
- Report 03 (11.IV - 10.VI) +
- Report 02 (1.IV - 31.V) +
- Report 01 (21.III - 20.V)