ARCHIVES (2017)
Do roku 2016 raport oznaczony numerem 1 był tworzony za okres od 1 kwietnia do 31 maja. Od roku 2017 analizy są wykonywane o dekadę wcześniej czyli 1 raport oznacza okres od 21 marca do 20 maja
Communication report regarding the incidences of drought conditions in Poland
Year: 2017; period: 06 (11.V - 10.VII)
The Institute of Soil Science and Plant Cultivation – State Research Institute, in accordance with an Act of the Minister of Agriculture and Rural Development has developed the climatic water balance for all 2478 Polish local districts and, on the basis of soil categories, calculated the current risk of agricultural drought for the following crops: winter and spring cereals, grain maize and maize for silage, rape and turnip rape, potatoes, sugar beet, hops, tobacco, ground vegetables, fruit shrubs and trees, strawberries and legumes.
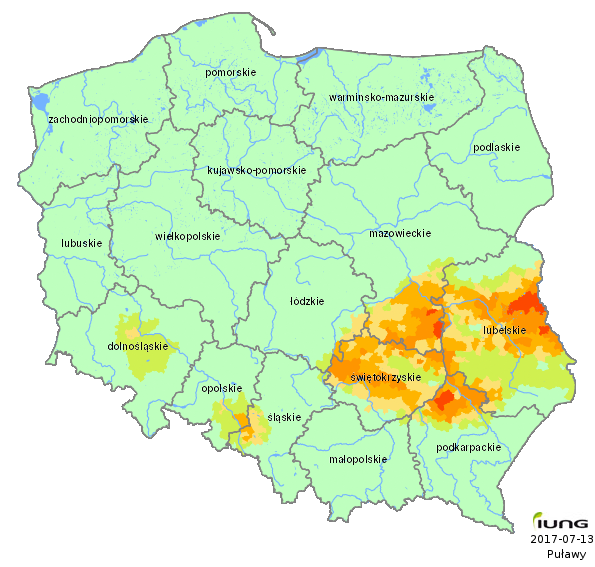
In the sixth reporting period, i.e. from May 11th t° July 10th 2017, IUNG-PIB stated agricultural drought conditions in Poland. The Climatic Water Balance values, which are the basis for assessing the risk of agricultural drought, are negative for the majority of areas.
In the current sixty-day reporting period drought occurs in ten species or groups of plants:
- Rape and turnip rape
- Spring cereals
- Legumes
- Winter cereals
- Fruit shrubs
- Strawberries
- Tobacco
- Ground vegetables
- Grain maize
- Maize for silage
Currently the highest risk of agricultural drought occurs in rape and turnip rape cultivated on soils of Category II and III of drought susceptibility.
Category II consists of light soils, granulometric groups as follows:
Light loamy sand
Light loamy dusty sand
Heavy loamy sand
Heavy loamy dusty sand
Category III consists of medium quality soils, granulometric groups as follows:
Light clay
Light dusty clay
Silty loam
Silt
Sandy silt
Drought occurs in rape and turnip rape in 9 voivodships in 548 local districts (gminas) in Poland (i.e. 22.11% of all local districts in Poland) in the area of 4.1% of arable land in the country. Table 1 presents detailed data on drought occurrence for local districts and the area of arable land in particular voivodships.
Table 1.
| No. | Voivodship | Number of local districts | Number of local districts at risk | Share of local districts at risk [%] | Share of the area at risk [%] |
|---|---|---|---|---|---|
| 1. | lubelskie | 213 | 187 | 87.79 | 17.56 |
| 2. | świętokrzyskie | 102 | 94 | 92.16 | 15.96 |
| 3. | mazowieckie | 314 | 89 | 28.34 | 8.30 |
| 4. | dolnośląskie | 169 | 48 | 28.40 | 2.96 |
| 5. | śląskie | 167 | 46 | 27.54 | 4.38 |
| 6. | podkarpackie | 160 | 41 | 25.62 | 4.23 |
| 7. | opolskie | 71 | 27 | 38.03 | 4.46 |
| 8. | łódzkie | 177 | 14 | 7.91 | 1.82 |
| 9. | małopolskie | 182 | 2 | 1.10 | 0.16 |
Drought still occurs in spring cereals, on soils of Category I, II and III of drought susceptibility. It was noted in 9 voivodships in 442 local districts in Poland (235 more in comparison to the previous reporting period). Drought occurs in 17.84% of all local districts in Poland (9.49% more than in the previous reporting period), on 4.13% of arable land (3.26% more than previously). Table 2 presents detailed data on drought occurrence for local districts and the area of arable land in particular voivodships.
Table 2.
| No. | Voivodship | Number of local districts | Number of local districts at risk | Share of local districts at risk [%] | Share of the area at risk [%] |
|---|---|---|---|---|---|
| 1. | świętokrzyskie | 102 | 86 | 84.31 | 23.32 |
| 2. | lubelskie | 213 | 172 | 80.75 | 19.07 |
| 3. | opolskie | 71 | 17 | 23.94 | 0.68 |
| 4. | podkarpackie | 160 | 36 | 22.50 | 6.89 |
| 5. | mazowieckie | 314 | 66 | 21.02 | 7.57 |
| 6. | dolnośląskie | 169 | 31 | 18.34 | 0.58 |
| 7. | śląskie | 167 | 25 | 14.97 | 1.26 |
| 8. | łódzkie | 177 | 8 | 4.52 | 0.82 |
| 9 | małopolskie | 182 | 1 | 0.55 | 0.00 |
Drought occurs also in legumes, on soils of Category I and II of drought susceptibility. It was noted in 257 local districts in Poland (245 more in comparison to the previous reporting period). Drought occurs in 10.37% of local districts in Poland (9.89% more than in the previous reporting period), on 1.99% of arable land (1.93% more than in the previous reporting period).
Table 3 presents detailed data on drought occurrence for local districts and the area of arable land in particular voivodships.
Table 3.
| No. | Voivodship | Number of local districts | Number of local districts at risk | Share of local districts at risk [%] | Share of the area at risk [%] |
|---|---|---|---|---|---|
| 1. | lubelskie | 213 | 122 | 57.28 | 11.32 |
| 2. | świętokrzyskie | 102 | 64 | 62.75 | 8.59 |
| 3. | mazowieckie | 314 | 43 | 13.69 | 3.81 |
| 4. | podkarpackie | 160 | 21 | 13.12 | 2.68 |
| 5. | śląskie | 167 | 4 | 2.40 | 0.05 |
| 6. | opolskie | 71 | 3 | 4.23 | 0.04 |
As in the previous reporting period so in the current one, drought occurred also in winter cereals. Currently drought occurs in 6 voivodships on soils of Category I and II of drought susceptibility. It was noted in 232 local districts (212 more in comparison to the previous reporting period). Drought occurs in 9.36% of local districts in Poland (8.55% more than in the previous reporting period), on 1.62% of arable land (1.49% more than previously).
Table 4 presents detailed data on drought occurrence for local districts and the area of arable land in particular voivodships.
Table 4.
| No. | Voivodship | Number of local districts | Number of local districts at risk | Share of local districts at risk [%] | Share of the area at risk [%] |
|---|---|---|---|---|---|
| 1. | lubelskie | 213 | 114 | 53.52 | 8.98 |
| 2. | świętokrzyskie | 102 | 59 | 57.84 | 6.20 |
| 3. | mazowieckie | 314 | 39 | 12.42 | 3.50 |
| 4. | podkarpackie | 160 | 18 | 11.25 | 2.25 |
| 5. | opolskie | 71 | 1 | 1.41 | 0.00 |
| 6. | śląskie | 167 | 1 | 0.60 | 0.00 |
Drought occurs in fruit shrubs on soils of Category I and II of drought susceptibility. It occurs in 4 voivodships in 207 local districts (8.35% of all local districts in Poland), on 1.59% of arable land.
Table 5 presents detailed data on drought occurrence for local districts and the area of arable land in particular voivodships.
Table 5.
| No. | Voivodship | Number of local districts | Number of local districts at risk | Share of local districts at risk [%] | Share of the area at risk [%] |
|---|---|---|---|---|---|
| 1. | lubelskie | 213 | 110 | 51.64 | 10.05 |
| 2. | świętokrzyskie | 102 | 46 | 45.10 | 4.50 |
| 3. | mazowieckie | 314 | 37 | 11.78 | 3.18 |
| 4. | podkarpackie | 160 | 14 | 8.75 | 1.99 |
Drought occurs in strawberries, on soils of Category I and II of drought susceptibility. It was noted in 4 voivodships, in 129 local districts (5.21% of all local districts in Poland), on 0.68% of arable land.
Table 6 presents detailed data on drought occurrence for local districts and the area of arable land in particular voivodships.
Table 6.
| No. | Voivodship | Number of local districts | Number of local districts at risk | Share of local districts at risk [%] | Share of the area at risk [%] |
|---|---|---|---|---|---|
| 1. | lubelskie | 213 | 77 | 36.15 | 4.81 |
| 2. | świętokrzyskie | 102 | 24 | 23.53 | 1.86 |
| 3. | mazowieckie | 314 | 18 | 5.73 | 0.95 |
| 4. | podkarpackie | 160 | 10 | 6.25 | 0.99 |
Drought occurs also in tobacco, on soils of Category I and II of drought susceptibility. It was noted in 4 voivodships, in 129 local districts (5.21% of all local districts in Poland), on 0.85% of arable land.
Table 7 presents detailed data on drought occurrence for local districts and the area of arable land in particular voivodships.
Table 7.
| No. | Voivodship | Number of local districts | Number of local districts at risk | Share of local districts at risk [%] | Share of the area at risk [%] |
|---|---|---|---|---|---|
| 1. | lubelskie | 213 | 77 | 36.15 | 6.68 |
| 2. | świętokrzyskie | 102 | 24 | 23.53 | 1.86 |
| 3. | mazowieckie | 314 | 18 | 5.73 | 0.95 |
| 4. | podkarpackie | 160 | 10 | 6.25 | 0.99 |
Drought occurs in ground vegetables, on soils of Category I and II of drought susceptibility. It was noted in 3 voivodships, in 43 local districts (1.74% of all local districts in Poland), on 0.27% of arable land.
Table 8 presents detailed data on drought occurrence for local districts and the area of arable land in particular voivodships.
Table 8.
| No. | Voivodship | Number of local districts | Number of local districts at risk | Share of local districts at risk [%] | Share of the area at risk [%] |
|---|---|---|---|---|---|
| 1. | lubelskie | 213 | 36 | 16.90 | 2.95 |
| 2. | świętokrzyskie | 102 | 4 | 3.92 | 0.01 |
| 3. | podkarpackie | 160 | 3 | 1.88 | 0.02 |
Drought occurs in grain maize, in lubelskie voivodship on soils of Category II of drought susceptibility. It was noted in 0.44% of all local districts in Poland), on 0.04% of arable land.
Table 9 presents detailed data on drought occurrence for local districts and the area of arable land in particular voivodships.
Table 9.
| No. | Voivodship | Number of local districts | Number of local districts at risk | Share of local districts at risk [%] | Share of the area at risk [%] |
|---|---|---|---|---|---|
| 1. | lubelskie | 213 | 11 | 5.16 | 0.44 |
Drought is noted also in maize for silage, in lubelskie voivodship on soils of Category II of drought susceptibility. It occurs in 0.44% of all local districts in Poland), on 0.04% of arable land.
Table 10 presents detailed data on drought occurrence for local districts and the area of arable land in particular voivodships.
Table 10.
| No. | Voivodship | Number of local districts | Number of local districts at risk | Share of local districts at risk [%] | Share of the area at risk [%] |
|---|---|---|---|---|---|
| 1. | lubelskie | 213 | 11 | 5.16 | 0.44 |
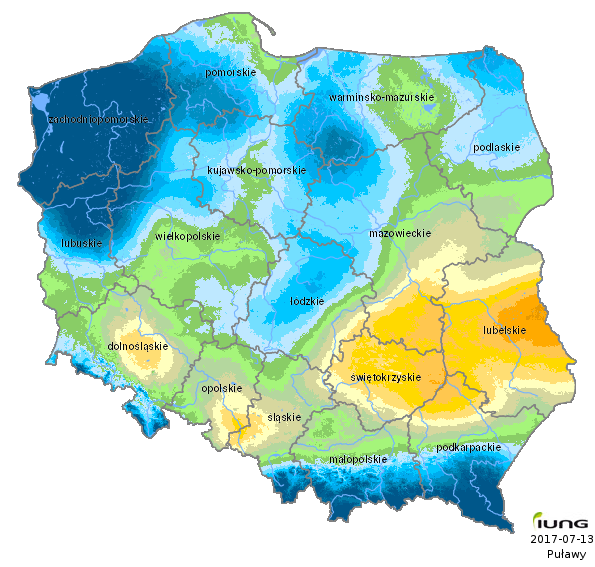
The average value of Climatic Water Balance in Poland in the current sixty-day reporting period was -112.5 mm, which was 22 mm lower than in the previous reporting period. Weather conditions during this reporting period resulted in considerable changes in the CWB values. In some regions the CWB values increased even by 147 mm and in others decreased by 85 mm. In the whole country they were higher than -219 mm and exceeded the critical values for ten crops, causing agricultural drought conditions in the large areas (548 local districts, i.e. 22.11% of all the local districts in Poland).
The lowest CWB values, from -210 to -219 mm were recorded in Łęczyńsko-Włodawska Plain and in Dubienka Depression.
Low CWB values were still recorded in the area of the Horodło Plateau (Grzęda Horodelska), the Chełm Hills (Pagóry chełmskie), and Działy Grabowieckie, from -200 to -209 mm. Considerable water deficiency, from -160 to -179 mm was noted in the Uplands: Lubelska, Małopolska, Krakowsko-Częstochowska, Silesian Upland and Silesian Lowland.
Low water deficiency still occurred in the Pomeranian Lake District and in Carpathian Foothills.
May was warm this year, with air temperature ranging from 10 to 15°C. The highest temperatures were recorded in the Silesian and Central Masovian Lowlands and in the Sandomierska Basin (14-15°C), where they exceeded the multiannual norm by 0.5-1°C. The lowest temperatures ranging from 11 to 13°C occurred in the north of the country. In the vast majority of the country temperature ranged from 13 to 14°C and was close to the multiannual norm
All three decades of June were characterised by highly diversified temperatures, and the air temperature distribution was similar in the whole country. The lowest temperatures were recorded in the north-eastern part of the country, from even below 14 to 15°C in the first decade, 1°C higher in the second and 2°C higher in the third decade of June. In the western, south-western and eastern parts of the country were recorded the highest temperatures, between 16 and 18°C in the first and second decade, and exceeding 20°C in the third decade of June.
The first decade of July was cold. The lowest temperatures were recorded in the north-eastern regions of Poland, from below 15 to 16°C. The highest temperatures occurred in the north-western regions, ranging from 17 to more than 18.5°C.
In May precipitation was also highly diversified. Precipitation from below 20 to 30 mm occurred in the Silesian Lowland and in the northern and north-eastern regions of the country, constituting 30-70% of the multiannual norm. In the vast majority of areas precipitation ranged from 30 to 50 mm, which is 70-90% of the norm. Very high precipitation (60-110 mm) was recorded in the Szczecińska and Podlaska Lowlands and in the Carpathian Foothills, where it constituted 100 to 170% of the multiannual norm. Particularly intense precipitation occurred in Podhale and Tatra Mountains, 110 to more than 130 mm, which constituted 100 to 110% of the multiannual norm.
The first decade of June was also highly diversified in terms of precipitation distribution. In the eastern part of the country it ranged from below 5 to 10 mm. More intense precipitation occurred in the western and central parts of Poland, ranging from 10 to 50, or even more than 60 mm. In the second decade, on the other hand, in the eastern and northern regions precipitation was relatively intense, from 10 to more than 60 mm. In the rest of the country it ranged from 5 to 20 mm. In the third decade of June precipitation was characterized by the highest degree of diversification. In the south, precipitation was very low, between 5 and 10 mm, while in the vast majority of Central Poland it was quite intense, between 40 and 90 mm.
In the first decade of July relatively intense precipitation occurred in three areas: in the north, south and central part of the country, where it ranged from 20 to 80 mm. In the rest of Poland precipitation was scarce, from 5 to 20 mm or, at times, below 5 mm.
In the following sixty-day reporting period a higher diversification of Climatic Water Balance values can be observed. In some areas there is a considerable water deficiency, whilst in the others water conditions for crops are good or very good, e.g. in the Pomeranian Lake District. The areas particularly at risk of water deficiency are still the same: Lubelskie, western part of Lesser Poland and Lower Silesia. In these areas water deficiency has increased from 20 to 30 mm causing yield reduction by 20% in comparison to the yield obtained in average weather conditions.
Report prepared by:
Dr hab. Andrzej Doroszewski, prof. nadzw.
Dr hab. Rafał Pudełko
Dr Katarzyna Żyłowska
Mgr Piotr Koza
Mgr Elżbieta Wróblewska
Reports
- Report 14 (1.VIII - 30.IX)
- Report 13 (21.VII - 20.IX)
- Report 12 (11.VII - 10.IX)
- Report 11 (1.VII - 31.VIII) +
- Report 10 (21.VI - 20.VIII)
- Report 09 (11.VI - 10.VIII)
- Report 08 (1.VI - 31.VII)
- Report 07 (21.V - 20.VII)
- Report 06 (11.V - 10.VII) +
- Report 05 (1.V - 30.VI) +
- Report 04 (21.IV - 20.VI)
- Report 03 (11.IV - 10.VI)
- Report 02 (1.IV - 31.V)
- Report 01 (21.III - 20.V)