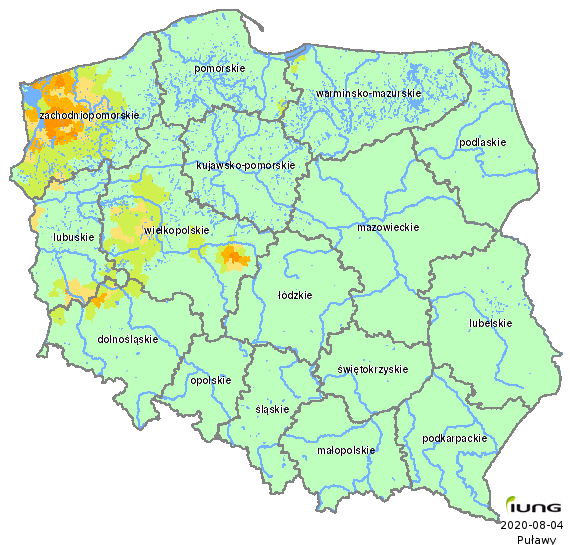
Potential zones of drought
Year: 2020; period: 08 (1.VI - 31.VII) - Leguminous crops
|Sugar beet| |Hops| |Fruit trees| |Fruit shrubs| |Silage maize | |Grain maize| |Leguminous crops| |Strawberries| |Tobacco| |Field grown vegetables| |Spring cereals| |Winter cereals| |Potato|
| Voivodeship (NUTS-2) | Total number of administrative districts | Number of the administrative districts under threat of drought | Percentage of administrative districts under threat of drought | Percentage of area under threat of drought |
|---|---|---|---|---|
| dolnośląskie | 169 | 15 | 8.88 | 0.70 |
| kujawsko-pomorskie | 144 | 0 | 0.00 | 0.00 |
| lubelskie | 213 | 0 | 0.00 | 0.00 |
| lubuskie | 82 | 13 | 15.85 | 2.26 |
| łódzkie | 177 | 0 | 0.00 | 0.00 |
| małopolskie | 182 | 0 | 0.00 | 0.00 |
| mazowieckie | 314 | 0 | 0.00 | 0.00 |
| opolskie | 71 | 0 | 0.00 | 0.00 |
| podkarpackie | 160 | 0 | 0.00 | 0.00 |
| podlaskie | 118 | 0 | 0.00 | 0.00 |
| pomorskie | 123 | 1 | 0.81 | 0.00 |
| śląskie | 167 | 0 | 0.00 | 0.00 |
| świętokrzyskie | 102 | 0 | 0.00 | 0.00 |
| warmińsko-mazurskie | 116 | 2 | 1.72 | 0.00 |
| wielkopolskie | 226 | 59 | 26.11 | 2.35 |
| zachodniopomorskie | 113 | 73 | 64.60 | 12.94 |
| Polska | 2477 | 163 | 6.58 | 1.10 |
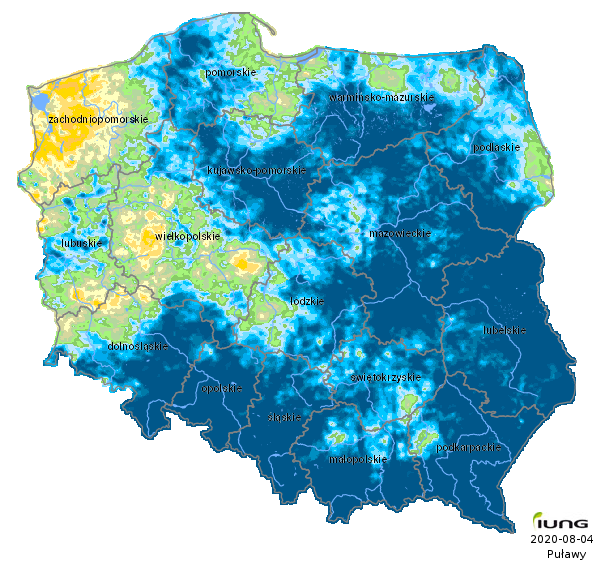
Participation of soils at drought risk
| The drought benchmark (according to the Act. Dz. U No. 150) was not exceeded | |
| < 10 % soils | |
| 10 - 30 % soils | |
| 30 - 50 % soils | |
| 50 - 80 % soils | |
| > 80 % soils |
Risk maps
Leguminous crops
Comment from Agrometeorologist
IUNG-PIB zgodnie z wymogami Obwieszczenia opracował wartości klimatycznego bilansu wodnego dla wszystkich gmin Polski (2477 gmin) oraz w oparciu o kategorie gleb określił w tych gminach aktualny stan zagrożenia suszą rolniczą. .....
read more