ARCHIVES (2013)
Do roku 2016 raport oznaczony numerem 1 był tworzony za okres od 1 kwietnia do 31 maja. Od roku 2017 analizy są wykonywane o dekadę wcześniej czyli 1 raport oznacza okres od 21 marca do 20 maja
Communication report regarding the incidences of drought conditions in Poland
Year: 2013; period: 11 (11.VII - 10.IX)
The Institute of Soil Science and Plant Cultivation - State Research Institute in accordance with an Act from the Minister of Agriculture and Rural Development has developed the climatic water balance for all Polish municipalities (3,064 municipalities), and based on the soils categories have identified in those municipalities the current agricultural drought risk for the following crops: winter and spring cereals, corn for grain and silage, potatoes, sugar beets, hops, tobacco, field vegetables, shrubs and fruit trees, strawberries and legumes.
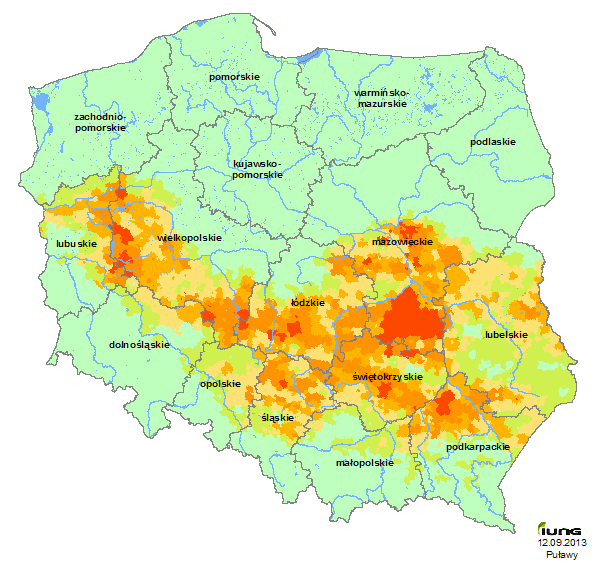
In the eleventh reporting period, i.e. from July 11 to September 10, 2013, IUNG-PIB states a risk of agricultural drought in Poland.
Drought occurs for crops:
• legumes
• potato,
• shrubs,
grown on soils of I and II category:
• Category I soil (very light),
• Category II soils (light).
The largest area of drought risk is considered for legumes cultivation. The drought covers for this group 11.8% of the arable Polish land, gathered in 1,294 local districts (42.2% of country local districts). Drought for legumes occurs in 11 Voivodeships:
|
Voivodeship |
Number of local districts at risk |
The share of local district at draught risk [%] |
The share of area at draught risk [%] |
|
Świętokrzyskie |
121 |
94.5 |
34.5 |
|
Łódzkie |
157 |
77.7 |
28.1 |
|
Mazowieckie |
205 |
56.3 |
23.2 |
|
Śląskie |
109 |
57.7 |
20.7 |
|
Wielkopolskie |
179 |
56.6 |
18.5 |
|
Podkarpackie |
105 |
55.6 |
16.1 |
|
Lubuskie |
63 |
54.3 |
13.6 |
|
Lubelskie |
207 |
88.5 |
12.8 |
|
Opolskie |
57 |
55.3 |
4.8 |
|
Dolnośląskie |
34 |
15.2 |
2.9 |
|
Małopolskie |
56 |
24.9 |
2.7 |
The threat of drought for potato and shrubs is at 3.6% Polish arable land concentrated in 318 local districts0 (10.4% of the local district of the country). Drought for potato and shrubs occurs in seven voivodeships:
|
Voivodeship |
Number of local districts at risk |
The share of local district at draught risk [%] |
The share of area at draught risk [%] |
|
Świętokrzyskie |
113 |
88.3 |
28.2 |
|
Mazowieckie |
72 |
19.8 |
12.9 |
|
Podkarpackie |
74 |
39.2 |
12.1 |
|
Lubelskie |
41 |
17.5 |
2.0 |
|
Małopolskie |
9 |
4.0 |
0.8 |
|
Łódzkie |
6 |
3.0 |
0.2 |
|
Śląskie |
3 |
1.6 |
0.1 |
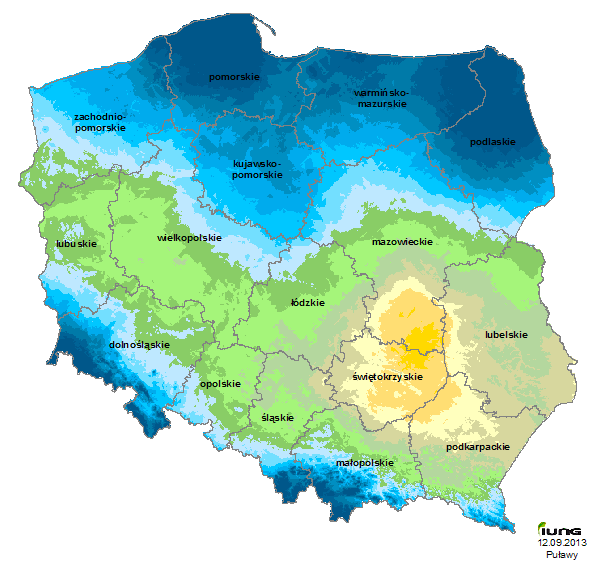
The values of climatic water balance (CWB), which are the basis used to assess the risk of drought in most Polish areas, are negative.
The CWB values, relative to the situation of the prior ten days has increased by an average of 32 mm. However, a large part of Poland still (except for the mountains and the north of the country) has a shortage of water.
In comparison to the previous sixty-day period up until the current period (from July 11 to September 10), throughout the country there has been a significant increase in the value of CWB, from 10 to 50 mm. Such a large increase in the CWB caused a reduction in water shortage for many crops in Poland and significantly reduced the agricultural drought risk area.
Distribution of CWB in the present sixty-day period was very similar to that of ten days ago, except that the present value of the previous period are higher by an average of approximately 30 mm.
The lowest values of CWB from -180 to -189 mm occurred as in the previous sixty-day period, in the Iłżeckie Foothills. A slightly smaller deficit of water was recorded in Radom, Kozienicka, Pilica Valley, Sandomierz Uplands, Gieleniowskim Garb, Szydłowskie foothills and the Połaniecka Basin and amounted to -160 to -179 mm. Large water shortages have also been reported in other areas of south-eastern Poland, ranging from -140 to -159 mm.
The relatively large area of northern and north-eastern Poland: embankment and eastern and south Bałtyckie Lake districts (in the eastern regions), the CWB ranged from -80 to -119 mm.
July this year was warm. The highest air temperature was recorded in south-western Poland, from 19.5 to 20.5°C, in the north-east direction the temperature was dropping and in the lower parts of the country, the Suwalki Lake District was 17.5-18°C. The Śląska and the Wielkopolska Lowland air temperature was higher than the long-term average (1971-2000) by more than 2°C, in central Poland it was higher by 1-2°C and in north-eastern and north of the country was close to the long-term average.
The area with the highest air temperature in August was the Sandomierz Basin; highlands: the Silesian-Krakow and Malopolska; Plains: Wielkopolska and Mazowiecka (southern areas), the temperature ranged from 19 to 19.5°C. In most parts of the country air temperature ranged from 18 to 19°C. The north-eastern area of Poland was the coldest region of the country, and the average air temperature ranged from 17 to 17.5°C.
In the first decade of September temperature in the country was very different, it was very warm in the west of the country from 15 to 16.5°C and in the eastern part of Poland was much cooler, from 11.5 to 14°C.
Relative to the previous sixty-day period, there was a reduction in evapotranspiration. The average evapotranspiration for the country was 221 mm and was lower by only 23 mm with respect to the previous sixty-day period. The highest evapotranspiration occurred in the Highlands of Lublin and the Malopolska; the Lowlands: Śląska, Mazowiecka, Wielkopolska and Lubuskie Lake District, and ranged from 230 to 245 mm. However, the lowest evapotranspiration (181-198 mm) was found in the northern parts of the country.
Poland in terms of precipitation in July was also very diverse with the lowest rainfall occurring in Mazowsze, which ranged from 20 to 30 mm, and in a belt between Kielce and Mława it was even lower than 20 mm. The area reported rainfall was well below the norm (about 20% of normal); however, the highest rainfall was recorded in the Mazurskie Lake District and the Zachodniosudeckim foothills and was about 100 mm. The precipitation norms were exceeded on the Gdansk Embankment, by up to 200%. This year July in terms of precipitation in Poland in most of the country was dry, and in some places even extremely dry.
In August, the lowest rainfall from a few to 20 mm was recorded in south-eastern Poland. In addition, low values of precipitation were recorded in the north-western parts of the country from 30 to 40 mm. In the most of the territory, the precipitation ranged from 50 to 70 mm. The highest rainfall ranging from 90 to 100 mm was recorded in the northern parts of Poland (coastal region of Koszalin).
In the first ten days of September, rainfall distribution was very similar to one of August. The lowest rainfalls from a few to 20 mm were recorded in the south-eastern and north-western parts of the country. However, the highest rainfall ranging from 40 to 45 mm was recorded (as in August) in the northern regions in the coastal region of Koszalin.
In two previous sixty-day period, the area with the greatest water deficit was in the regions of Mazowsze and Podlasie, Lublin, Subcarpathian and eastern parts of the Malopolska Uplands. The area of water deficit in the country in the current sixty-day period did not change and in these areas there is still a shortage of precipitation largest. However, the area of water deficit causing reduction of yields by 20% due to drought occurring in the country in the current period under consideration of sixty days decreased significantly. There was very little precipitation in July, August, and in the first ten days of September, and high evapotranspiration has caused that the country still has a water deficit, resulting in lower yields of some crops by 20% due to drought. The biggest shortage of water in many crops in the period from July 11 to September 10 occurred primarily in south-eastern Poland.
Reports
- Report 13 (1.VIII - 30.IX)
- Report 12 (21.VII - 20.IX)
- Report 11 (11.VII - 10.IX) +
- Report 10 (1.VII - 31.VIII) +
- Report 09 (21.VI - 20.VIII) +
- Report 08 (11.VI - 10.VIII)
- Report 07 (1.VI - 31.VII)
- Report 06 (21.V - 20.VII)
- Report 05 (11.V - 10.VII)
- Report 04 (1.V - 30.VI)
- Report 03 (21.IV - 20.VI)
- Report 02 (11.IV - 10.VI)
- Report 01 (1.IV - 31.V)


