ARCHIVES (2018)
Do roku 2016 raport oznaczony numerem 1 był tworzony za okres od 1 kwietnia do 31 maja. Od roku 2017 analizy są wykonywane o dekadę wcześniej czyli 1 raport oznacza okres od 21 marca do 20 maja
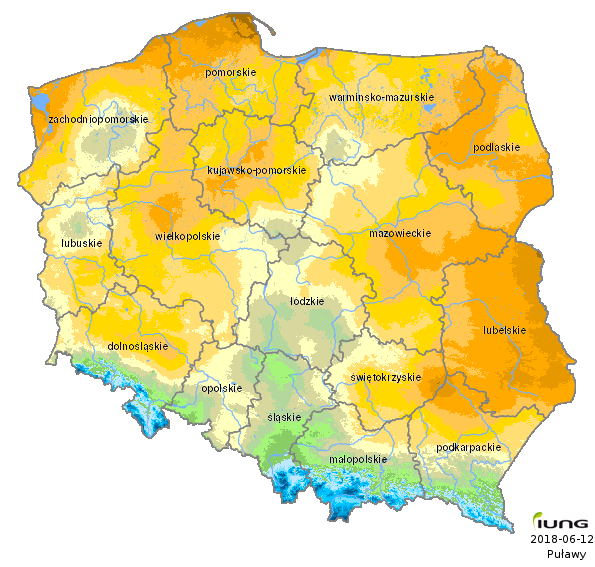
Potential zones of drought
Year: 2018; period: 03 (11.IV - 10.VI) - Fruit shrubs
|Sugar beet| |Fruit trees| |Fruit shrubs| |Rape and turnip rape| |Strawberries| |Spring cereals| |Winter cereals| |Potato|
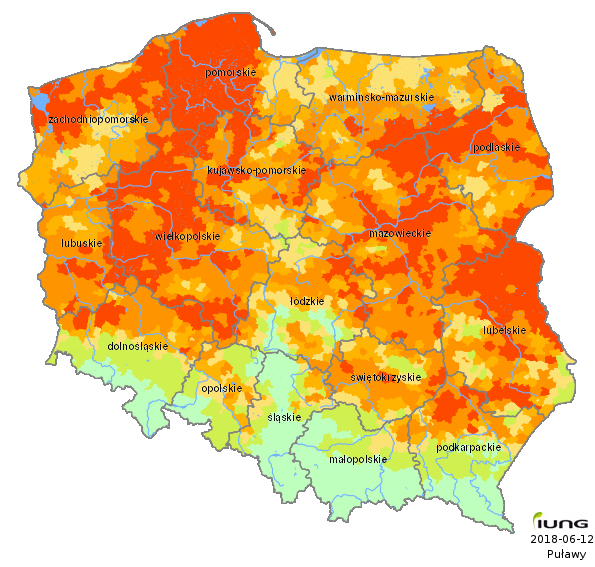
| Voivodeship (NUTS-2) | Total number of administrative districts | Number of the administrative districts under threat of drought | Percentage of administrative districts under threat of drought | Percentage of area under threat of drought |
|---|---|---|---|---|
| dolnośląskie | 169 | 123 | 72.78 | 27.92 |
| kujawsko-pomorskie | 144 | 144 | 100.00 | 57.14 |
| lubelskie | 213 | 213 | 100.00 | 61.71 |
| lubuskie | 82 | 82 | 100.00 | 63.17 |
| łódzkie | 177 | 162 | 91.53 | 36.92 |
| małopolskie | 182 | 60 | 32.97 | 4.54 |
| mazowieckie | 314 | 314 | 100.00 | 66.84 |
| opolskie | 71 | 58 | 81.69 | 9.95 |
| podkarpackie | 160 | 123 | 76.88 | 25.00 |
| podlaskie | 118 | 118 | 100.00 | 62.72 |
| pomorskie | 123 | 120 | 97.56 | 70.87 |
| śląskie | 167 | 56 | 33.53 | 8.90 |
| świętokrzyskie | 102 | 102 | 100.00 | 44.87 |
| warmińsko-mazurskie | 116 | 116 | 100.00 | 39.53 |
| wielkopolskie | 226 | 226 | 100.00 | 73.07 |
| zachodniopomorskie | 114 | 114 | 100.00 | 57.00 |
| Polska | 2478 | 2131 | 86.00 | 49.44 |
Participation of soils at drought risk
| The drought benchmark (according to the Act. Dz. U No. 150) was not exceeded | |
| < 10 % soils | |
| 10 - 30 % soils | |
| 30 - 50 % soils | |
| 50 - 80 % soils | |
| > 80 % soils |
Risk maps
Fruit shrubs
- Okres 14 (1.VIII - 30.IX)
- Okres 13 (21.VII - 20.IX)
- Okres 12 (11.VII - 10.IX) +
- Okres 11 (1.VII - 31.VIII) +
- Okres 10 (21.VI - 20.VIII) +
- Okres 09 (11.VI - 10.VIII) +
- Okres 08 (1.VI - 31.VII) +
- Okres 07 (21.V - 20.VII) +
- Okres 06 (11.V - 10.VII) +
- Okres 05 (1.V - 30.VI) +
- Okres 04 (21.IV - 20.VI) +
- Okres 03 (11.IV - 10.VI) +
- Okres 02 (1.IV - 31.V) +
- Okres 01 (21.III - 20.V)
Comment from Agrometeorologist
The Institute of Soil Science and Plant Cultivation – State Research Institute, in accordance with an Act of the Minister of Agriculture and Rural Development has developed the climatic water balance values for all 2478 Polish local districts (gminas) and, on the basis of soil categories, calculated the current risk of agricultural drought for the following crops: winter and spring cereals, rape and turnip rape, sugar beet, fruit shrubs and trees, and strawberries. .....
read more