ARCHIVES (2011)
Do roku 2016 raport oznaczony numerem 1 był tworzony za okres od 1 kwietnia do 31 maja. Od roku 2017 analizy są wykonywane o dekadę wcześniej czyli 1 raport oznacza okres od 21 marca do 20 maja
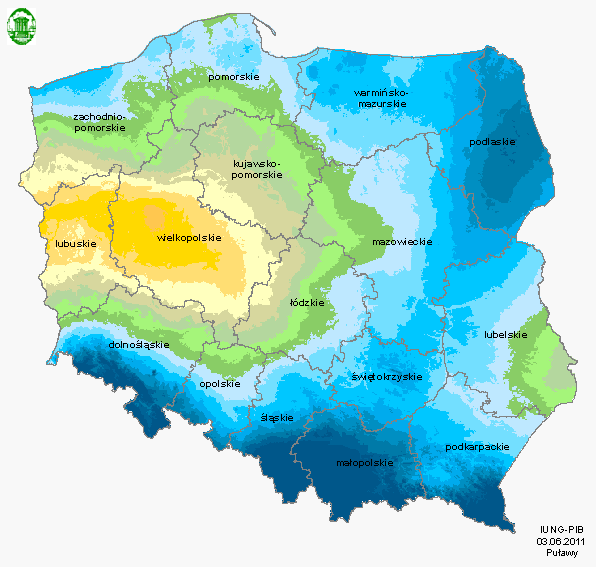
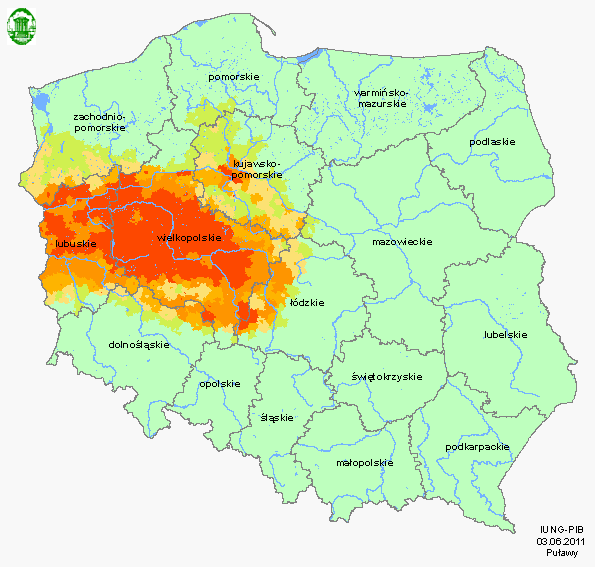
Potential zones of drought
Year: 2011; period: 01 (1.IV - 31.V) - Winter cereals
|Sugar beet| |Fruit trees| |Fruit shrubs| |Rape and turnip rape| |Strawberries| |Spring cereals| |Winter cereals|
| Voivodeship (NUTS-2) | Total number of administrative districts | Number of the administrative districts under threat of drought | Percentage of administrative districts under threat of drought | Percentage of area under threat of drought |
|---|---|---|---|---|
| dolnośląskie | 224 | 31 | 13.84 | 3.46 |
| kujawsko-pomorskie | 179 | 107 | 59.78 | 10.40 |
| lubelskie | 234 | 0 | 0.00 | 0.00 |
| lubuskie | 116 | 105 | 90.52 | 59.25 |
| łódzkie | 202 | 55 | 27.23 | 10.04 |
| małopolskie | 225 | 0 | 0.00 | 0.00 |
| mazowieckie | 364 | 2 | 0.55 | 0.02 |
| opolskie | 103 | 0 | 0.00 | 0.00 |
| podkarpackie | 189 | 0 | 0.00 | 0.00 |
| podlaskie | 141 | 0 | 0.00 | 0.00 |
| pomorskie | 140 | 4 | 2.86 | 0.12 |
| śląskie | 189 | 0 | 0.00 | 0.00 |
| świętokrzyskie | 128 | 0 | 0.00 | 0.00 |
| warmińsko-mazurskie | 149 | 0 | 0.00 | 0.00 |
| wielkopolskie | 316 | 293 | 92.72 | 69.07 |
| zachodniopomorskie | 165 | 48 | 29.09 | 4.38 |
| Polska | 3064 | 645 | 21.05 | 10.99 |
Participation of soils at drought risk
| The drought benchmark (according to the Act. Dz. U No. 150) was not exceeded | |
| < 10 % soils | |
| 10 - 30 % soils | |
| 30 - 50 % soils | |
| 50 - 80 % soils | |
| > 80 % soils |
Risk maps
Winter cereals
- Okres 13 (1.VIII - 30.IX)
- Okres 12 (21.VII - 20.IX)
- Okres 11 (11.VII - 10.IX)
- Okres 10 (1.VII - 31.VIII)
- Okres 09 (21.VI - 20.VIII)
- Okres 08 (11.VI - 10.VIII)
- Okres 07 (1.VI - 31.VII)
- Okres 06 (21.V - 20.VII)
- Okres 05 (11.V - 10.VII) +
- Okres 04 (1.V - 30.VI) +
- Okres 03 (21.IV - 20.VI) +
- Okres 02 (11.IV - 10.VI) +
- Okres 01 (1.IV - 31.V) +